Chapter 10 Regression
- Regression essentially involves creating a mathematical function that best describes the functional relationship between variables Xand Y. It is used in a two-step process: estimating the function for a full data set, and then applying it to a partial data set in which X, but not Y, is known (i.e., prediction).
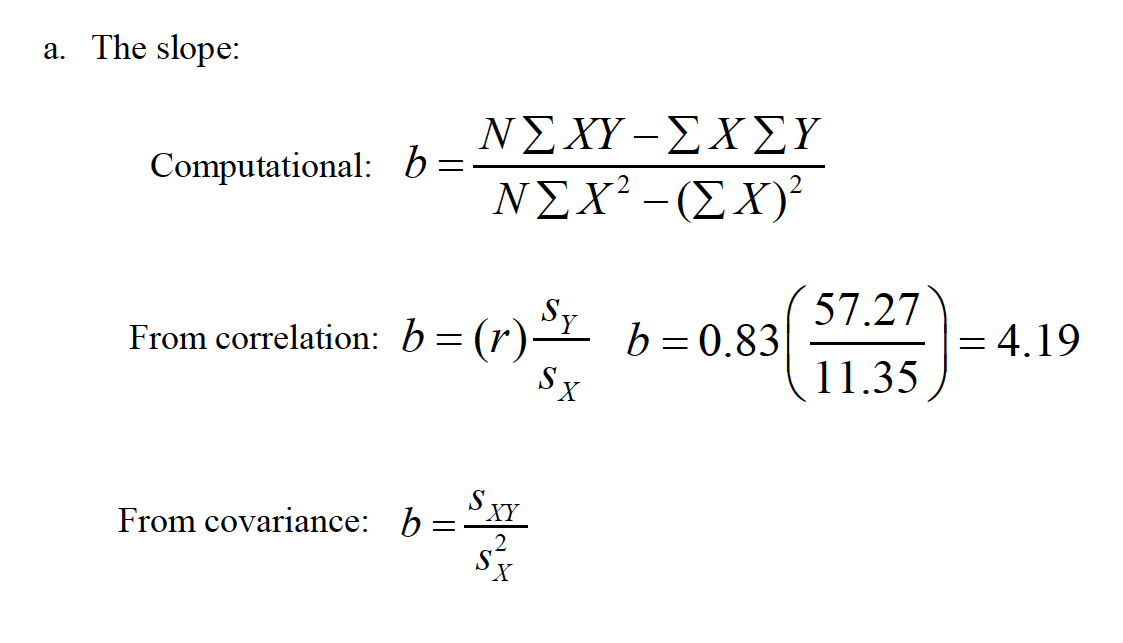
- There are different ways to compute the components of the regression line.
- We can also identify aspects of the regression line that give us an idea about the accuracy of prediction.
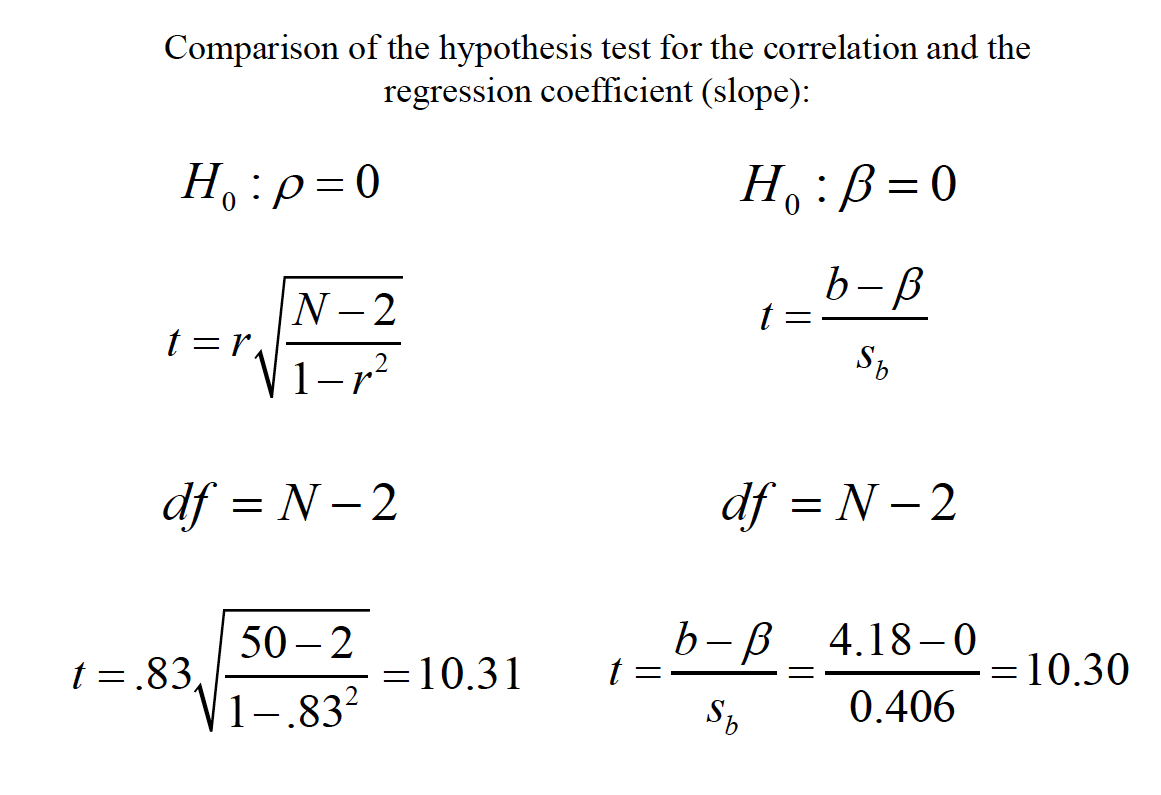
- We can test the significance of the regression coefficient (the slope) under the null hypothesis that the slope = 0. This is analogous to the null hypothesis test that the correlation = 0.
Xis referred to as the predictorvariable and Yis referred to as the criterionvariable.
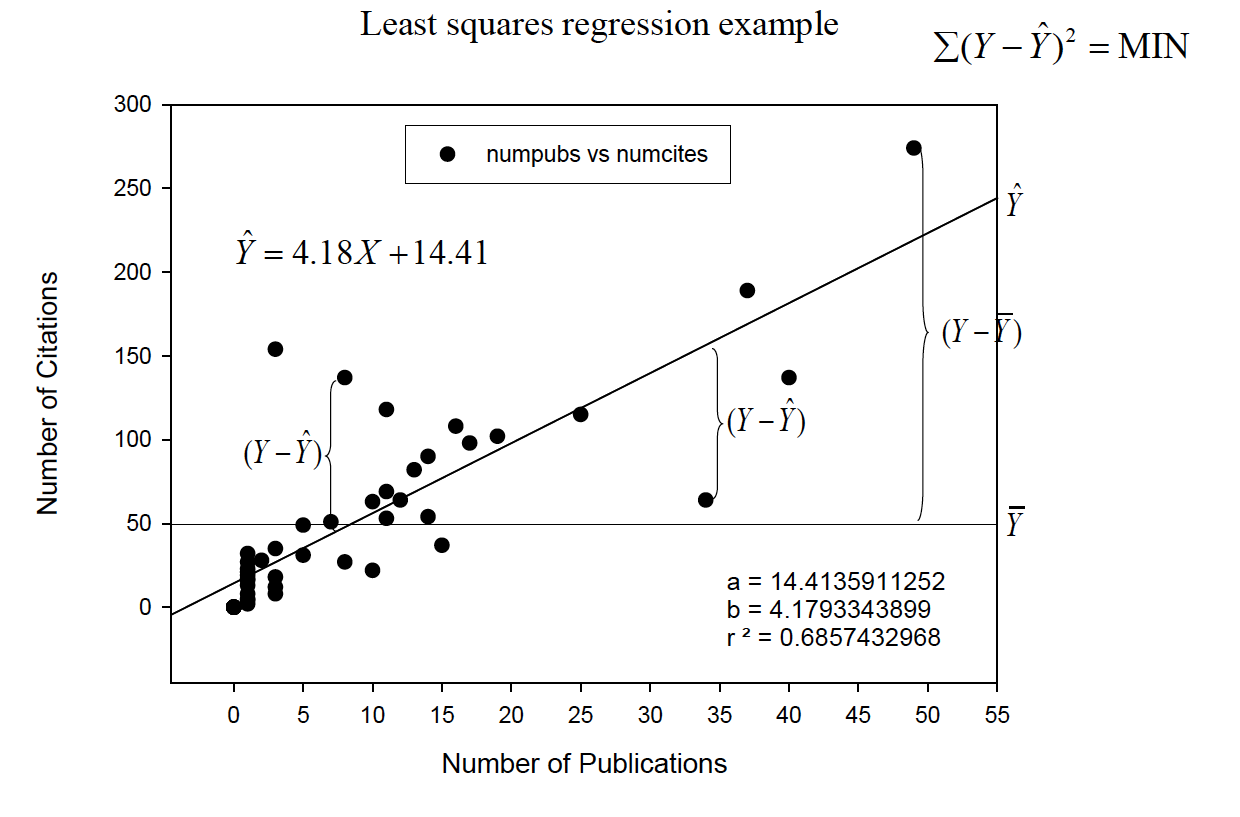
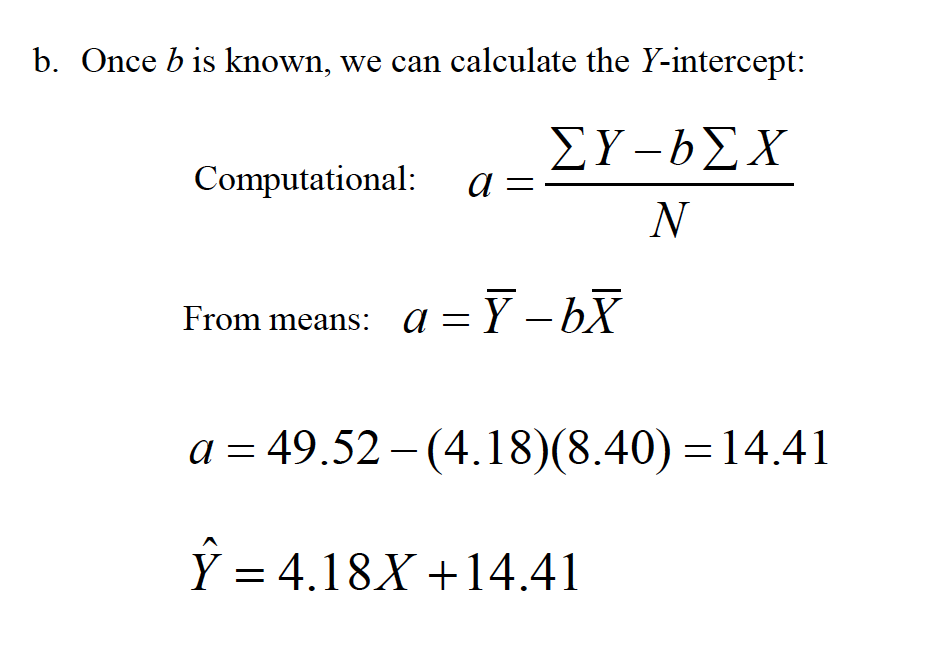
The slope-intercept form of the line is (SLOPE OF LINE see slides) i.The predictedscore on Yis ii.bis the slopeof the line iii.ais the Y-interceptof the line; that is, where the line intercepts the Yaxis when X= 0 ˆYbXa
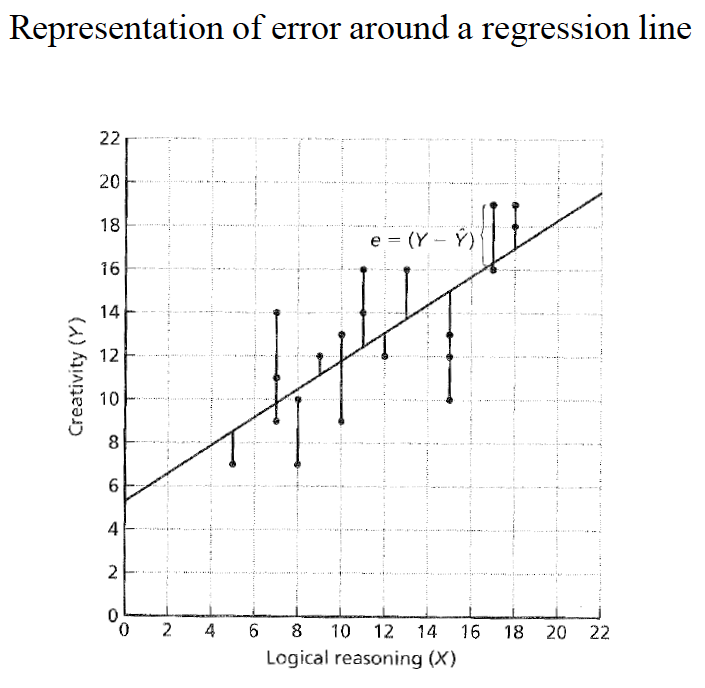
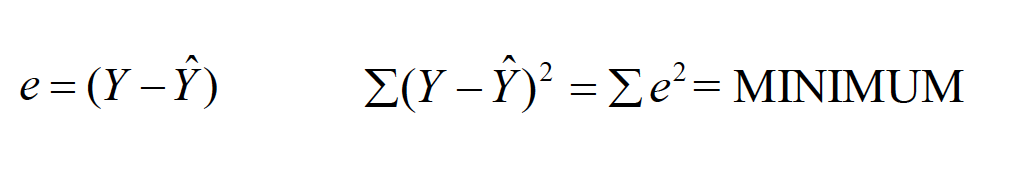
We fit the “best” line to the data set by using the least squaresprinciple—minimizing the summed, squared distance from each data point to the line. i. Error (e) is represented by the distance from each Y-point to the line.
Hicks
When we have found the lowest possible total squared error, we have identified the best-fitting line.
Hicks
Hicks
Hicks
Hicks
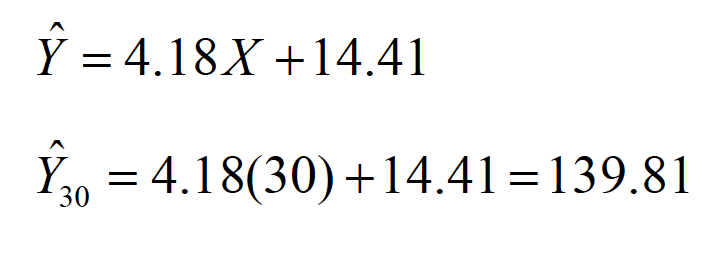
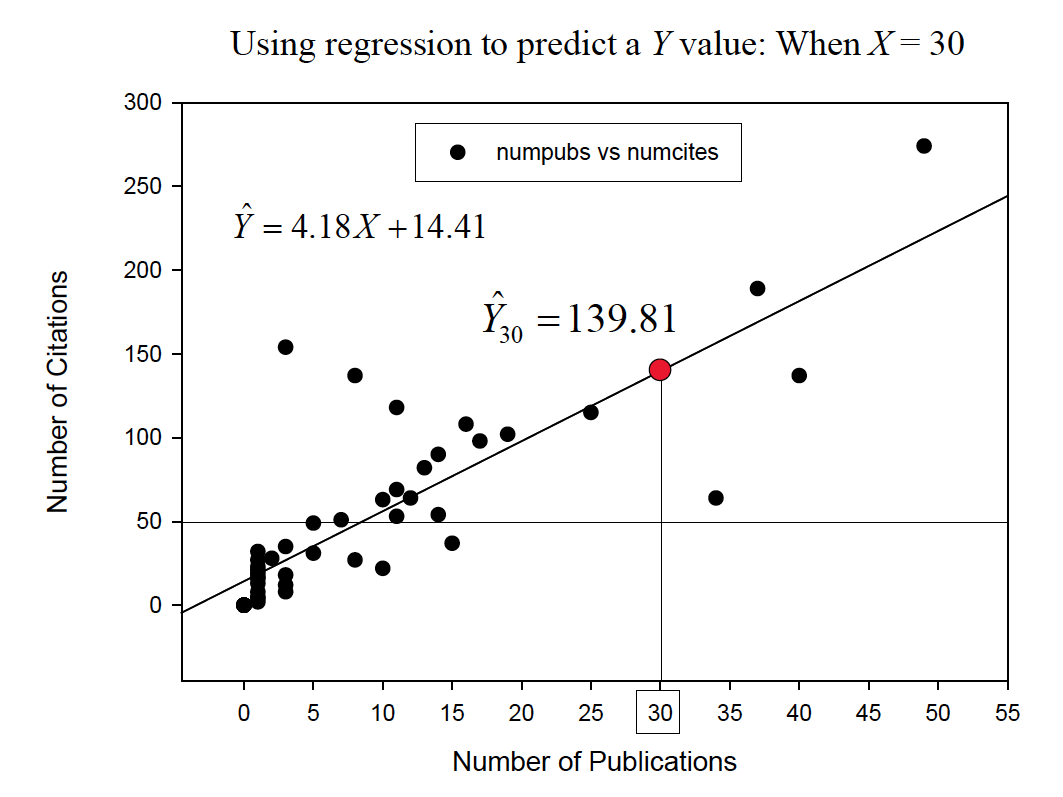
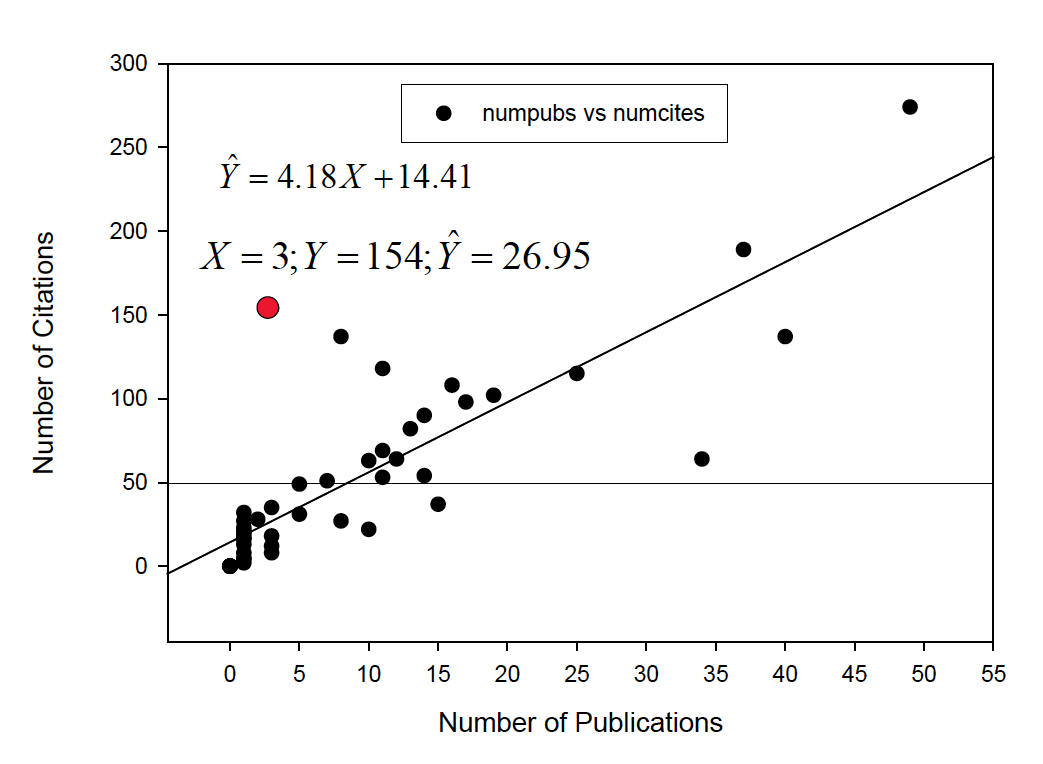
To find a predicted score for a data point, we simply substitute the Xvalue into the prediction equation.
Hicks
Hicks
Hicks
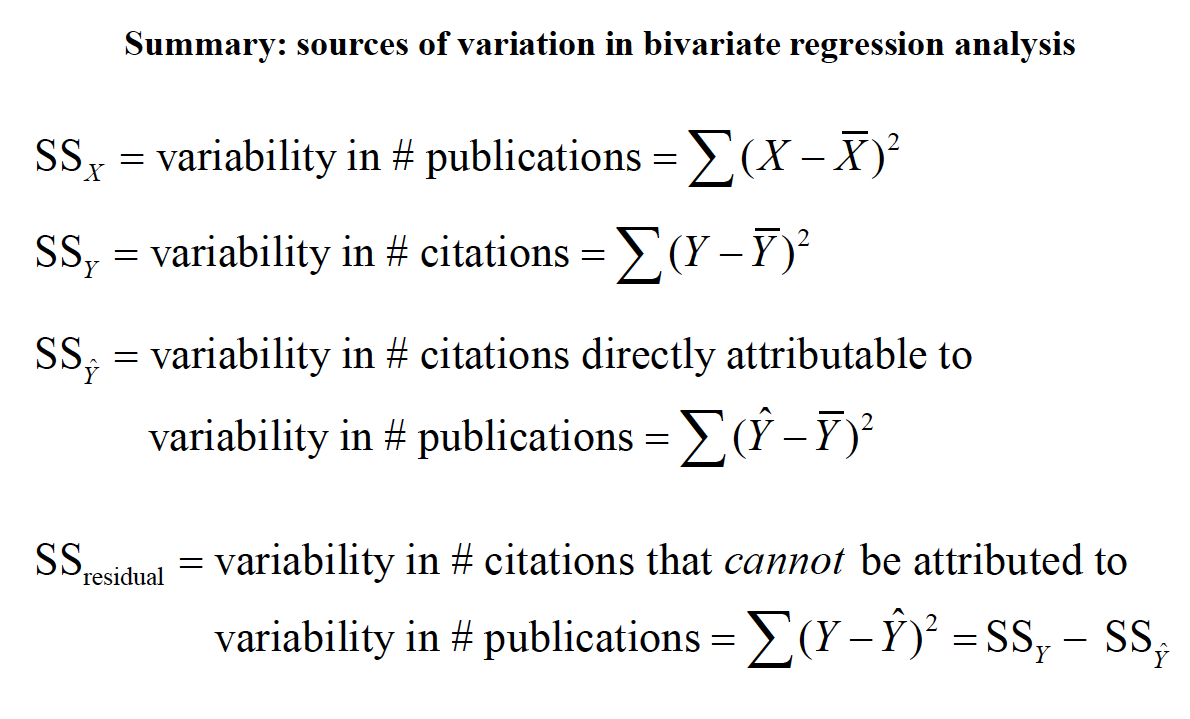
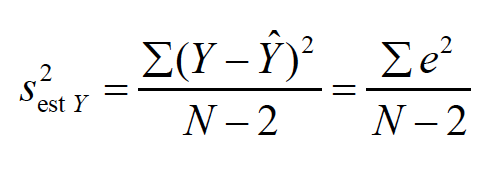
We can also identify aspects of the regression line that give us an idea about the accuracy of prediction. a. The error in prediction (e) is associated with its own distribution. The varianceof this distribution (i.e., the ‘variance of the estimate’) is
Hicks
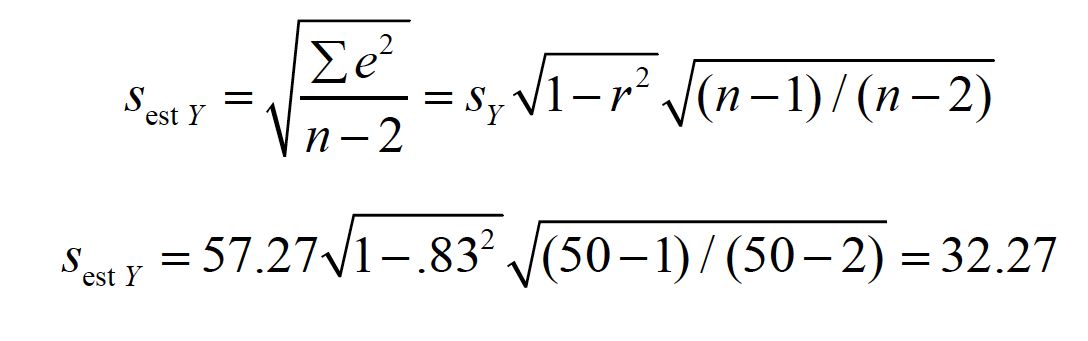
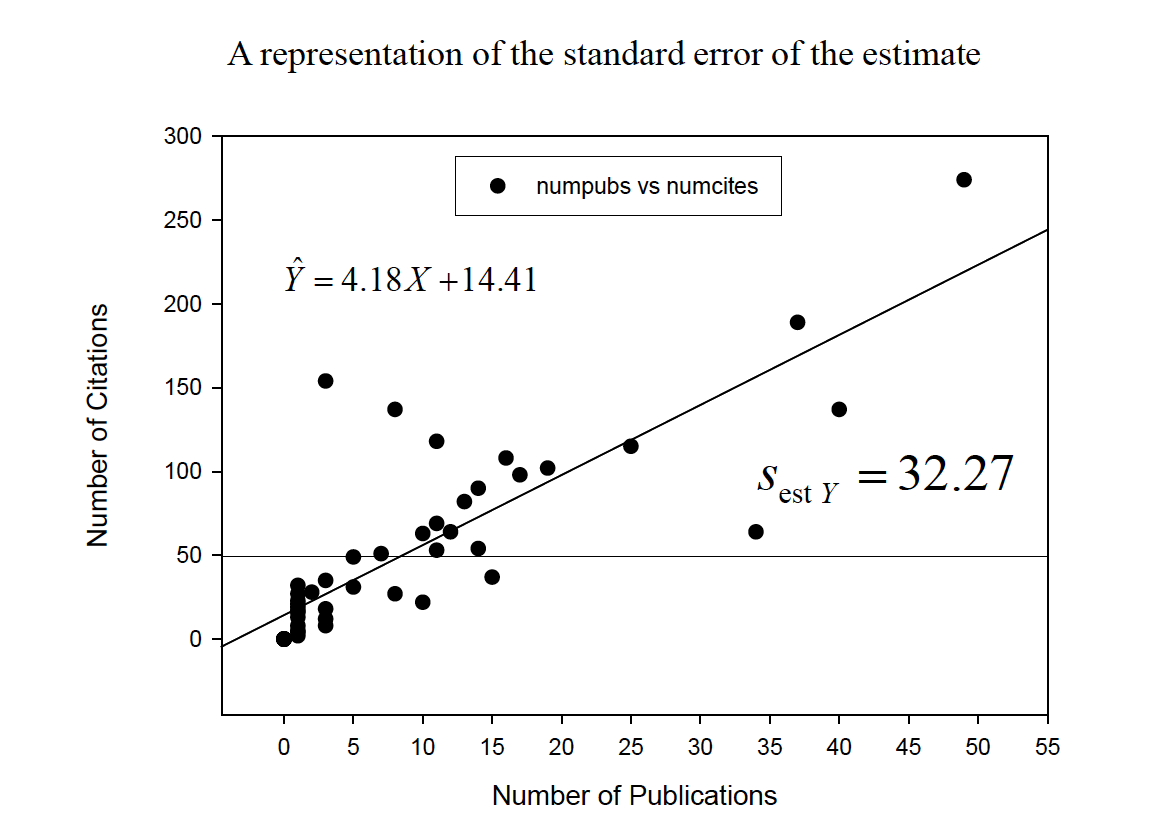
The standard deviation of this distribution is also called the standard error of the estimate
Hicks
Hicks
We can also identify aspects of the regression line that give us an idea about the accuracy of prediction
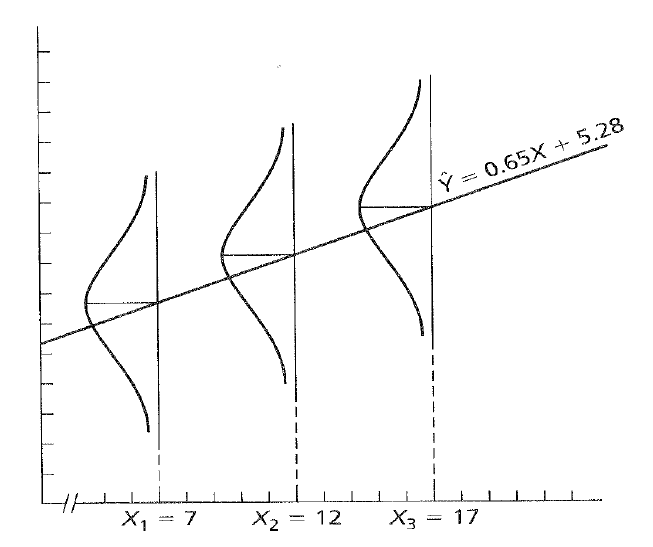
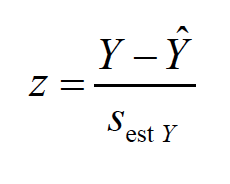
We can understand the standard error of the estimate in terms of the conditional distributionof Yfor each value of X. Each conditional distribution is assumed to have the same variance—homoscedasticity—and to have a normaldistribution.
Hicks
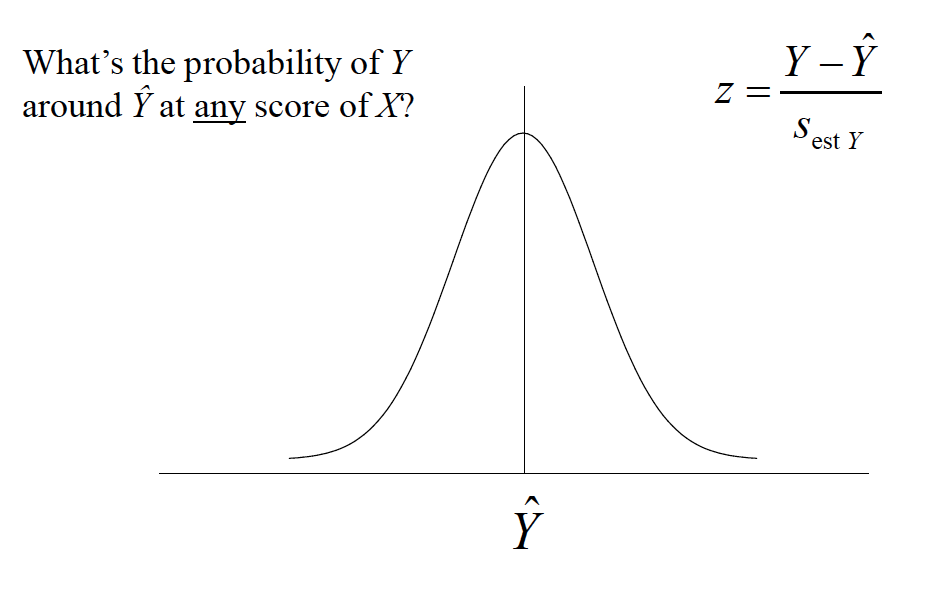
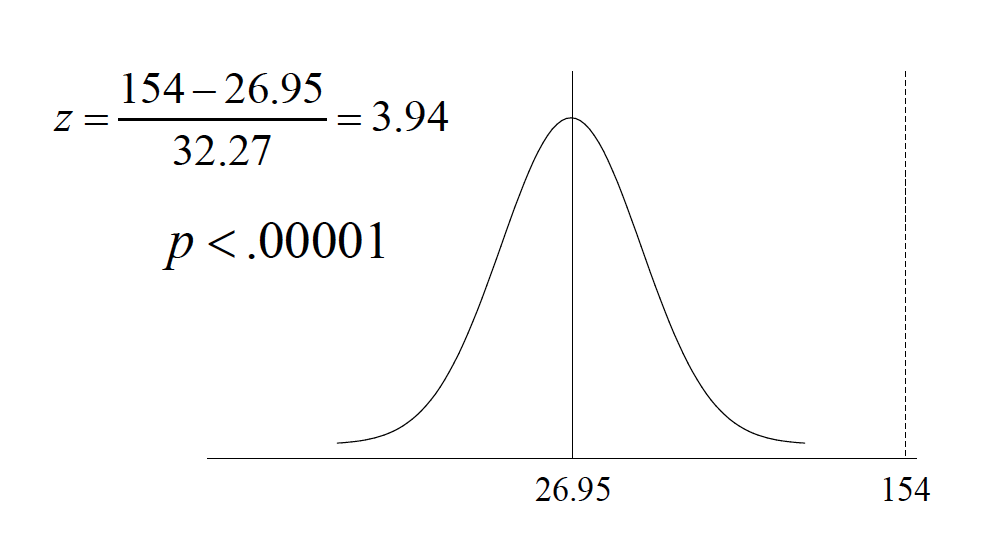
Because of these assumptions, we can make statements about the probability of predicted scores defined by the regression line
What’s the probability of Y around Yhat at anyscore of X?
Hicks
Hicks
Hicks
Hicks
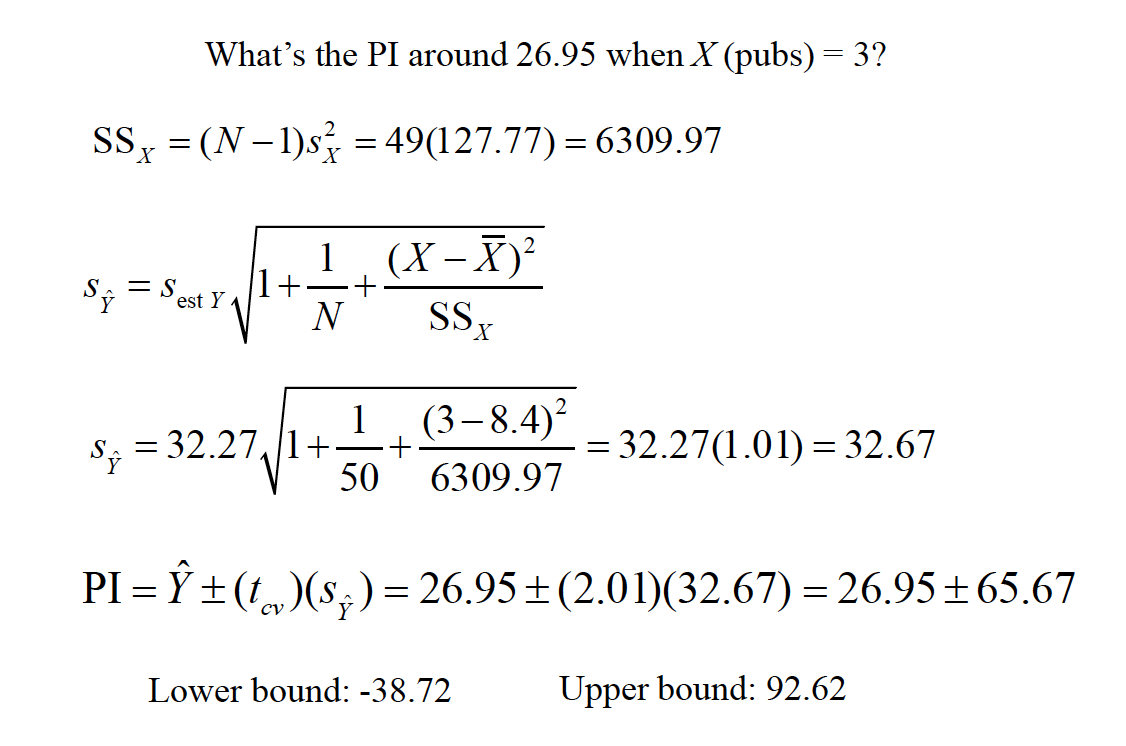
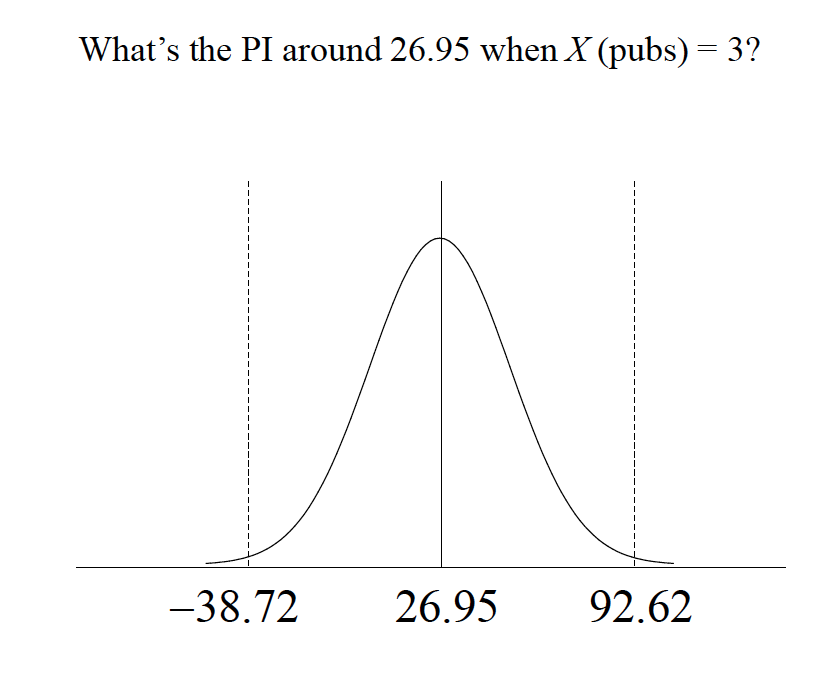
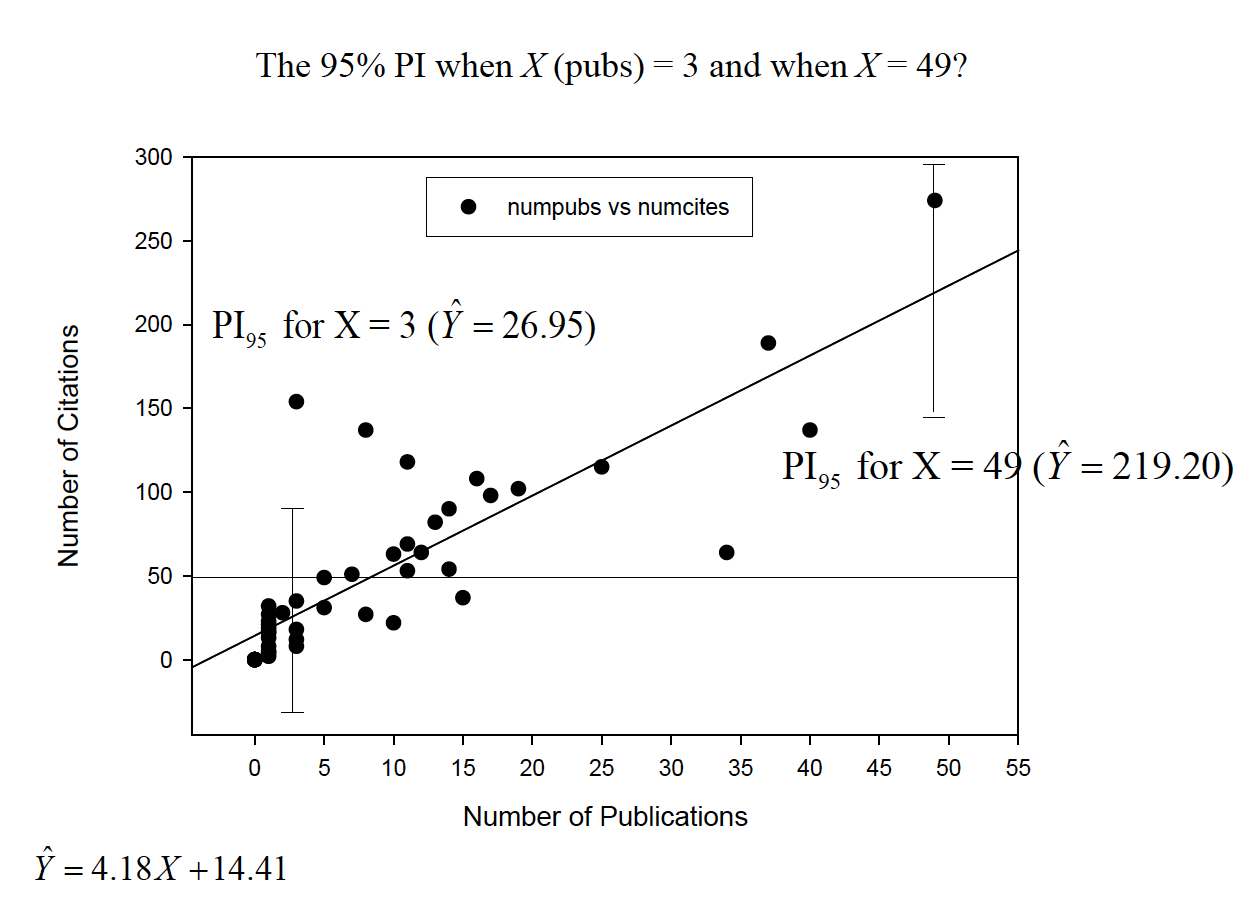
Because of these assumptions, we can make statements about intervals around true values of Yestimated by the regression line (prediction intervals)
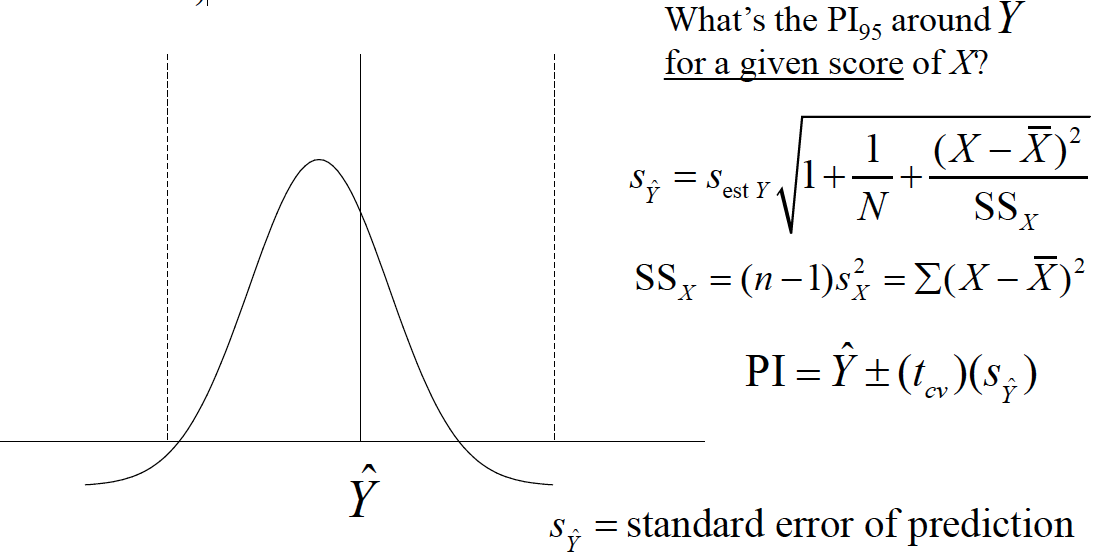
note y hat
note y hat
note y hat
note y hat
We can test the significance of the regression coefficient (the slope) under the null hypothesis that the slope = 0.
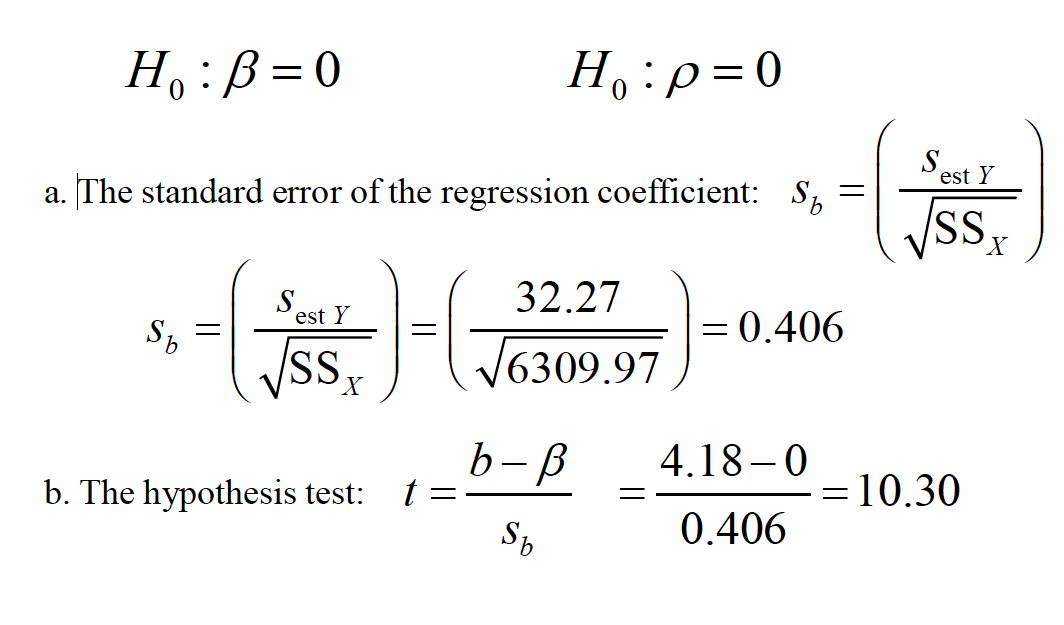
note y hat
note y hat
note y hat
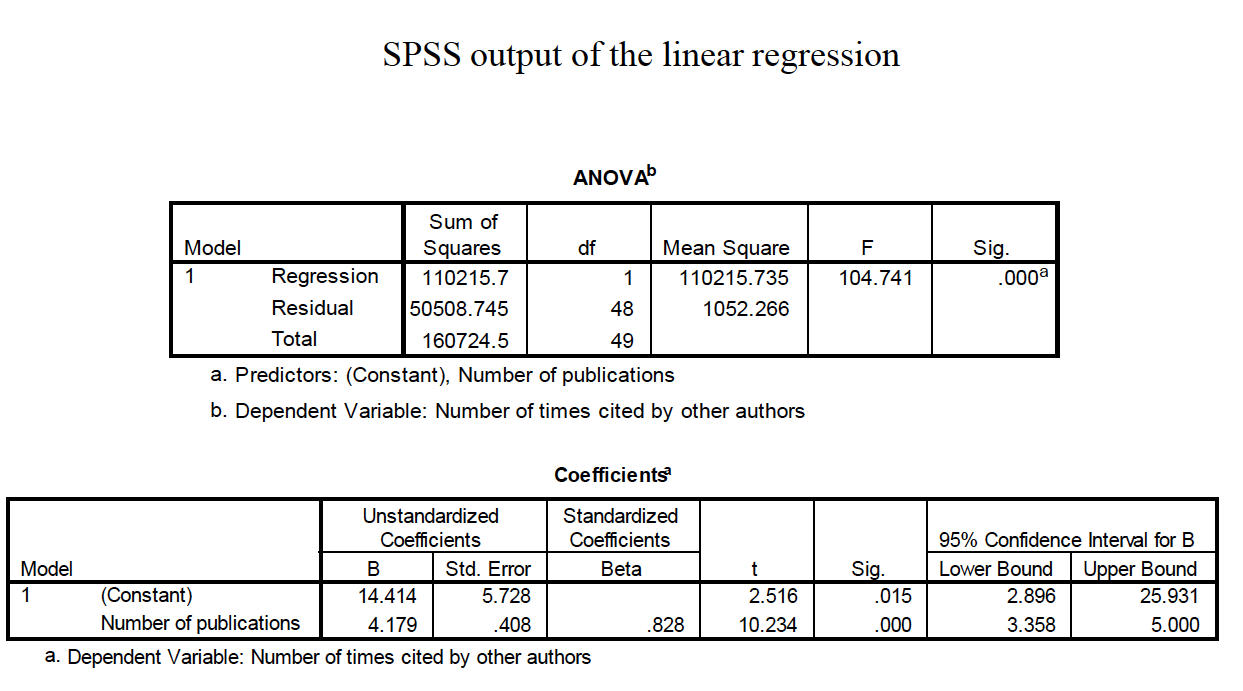
PUT THE R OUTPUT HERE