Chapter 17 Multiple Regression
- Multiple regression (and multiple correlation) refers the process of fitting a linear combination of multiple Xvariables to predict scores on Y.
- There are different ways to compute the components of the regression line.
- In multiple regression, we have to the multiple correlation coefficient(R) and its associated coefficient of determination (R2).
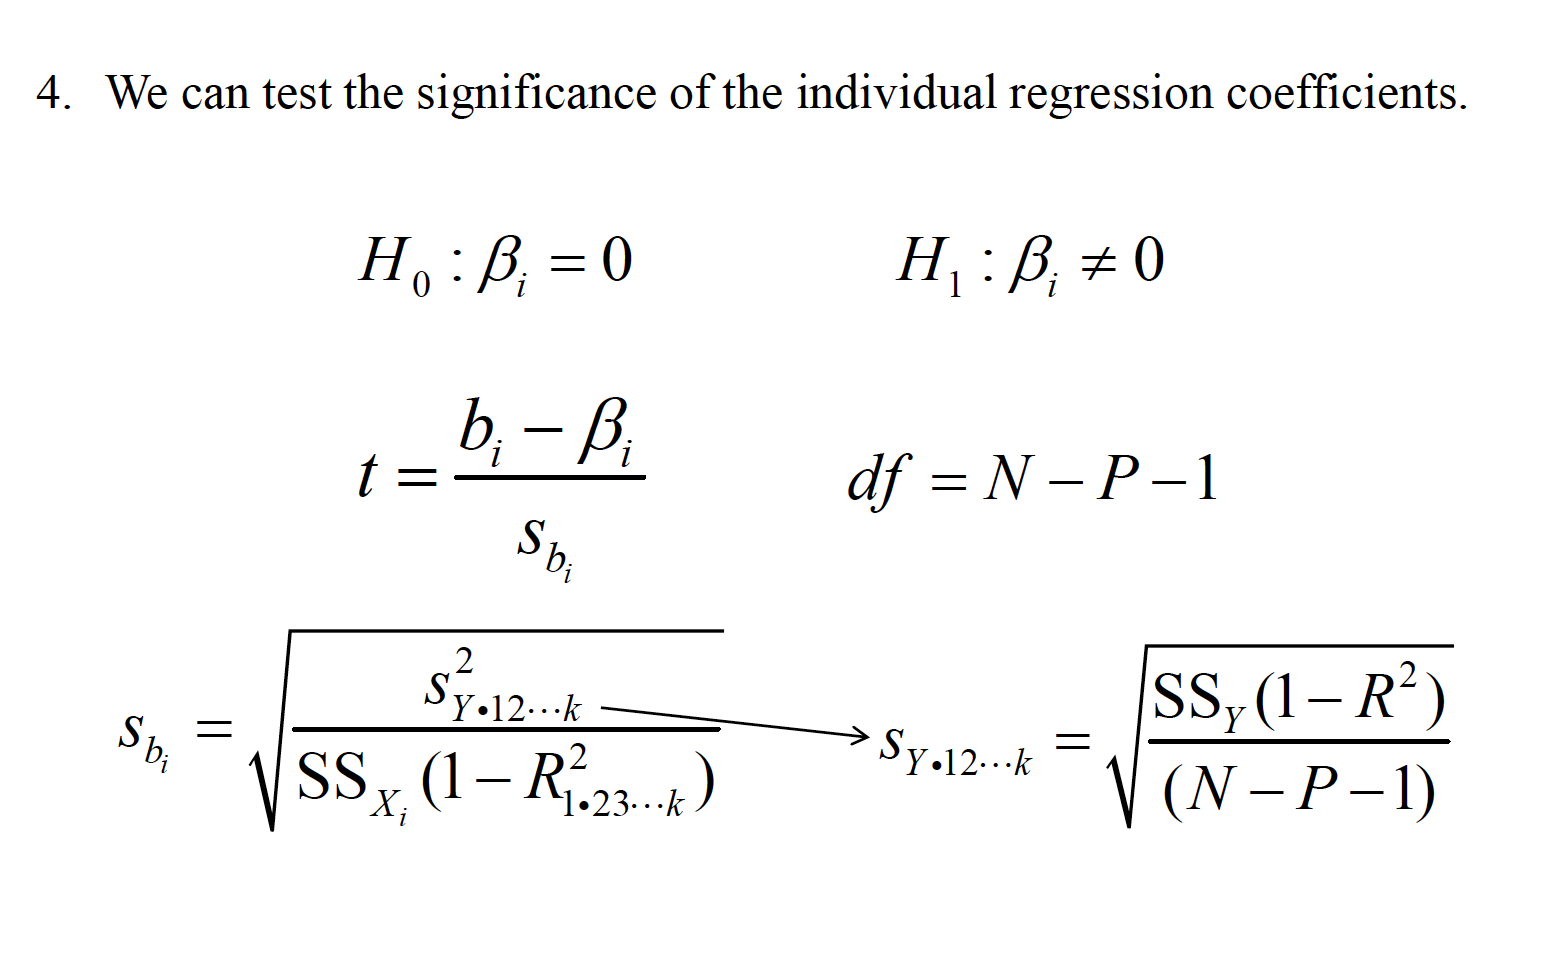
- We can test the significance of the individual regression coefficients under the null hypothesis that each is equal to 0.
Scenario: A researcher is interested in predicting the number of substance abuse relapses in a five year period following entrance into substance abuse treatment. She measured the following data for 120 women upon entry into the treatment program:
Depression Propensity for substance abuse Daily life stress Amount of social support from close others Perceived social support from close others
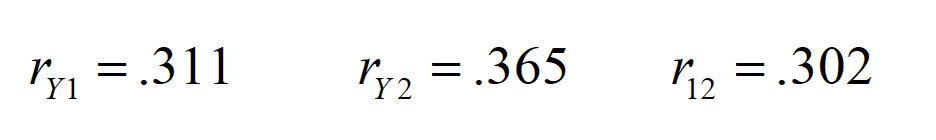
- CREATE CORRELATION TABLE
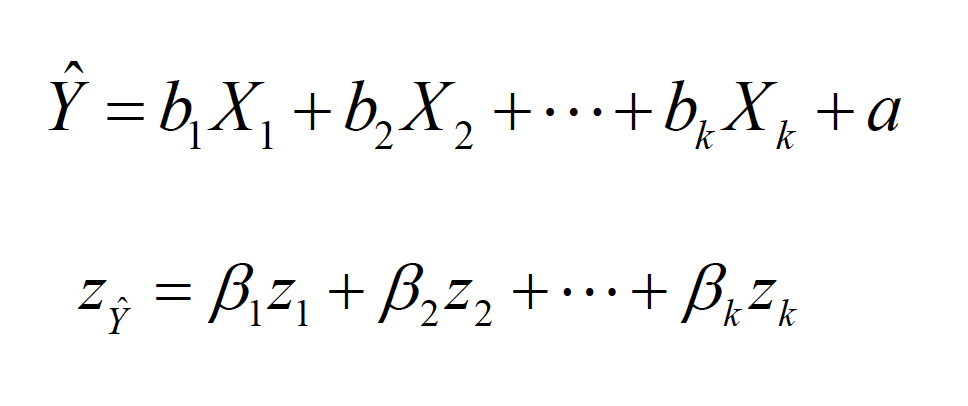
The slope-intercept form of the equation is
mr
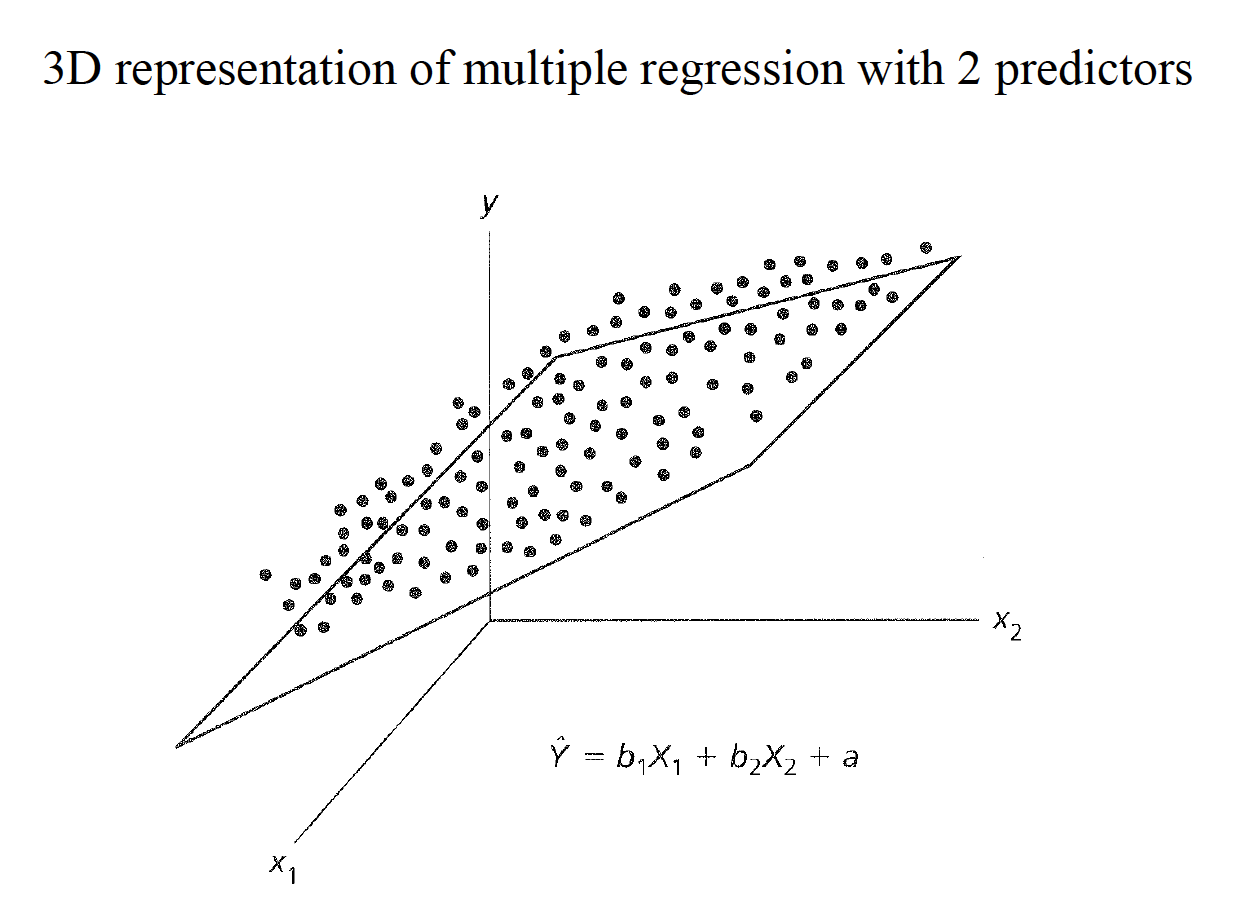
We fit the best “hyperplane” to the data set by using the least squaresprinciple.
mr
There are different ways to compute the components of the regression plane.
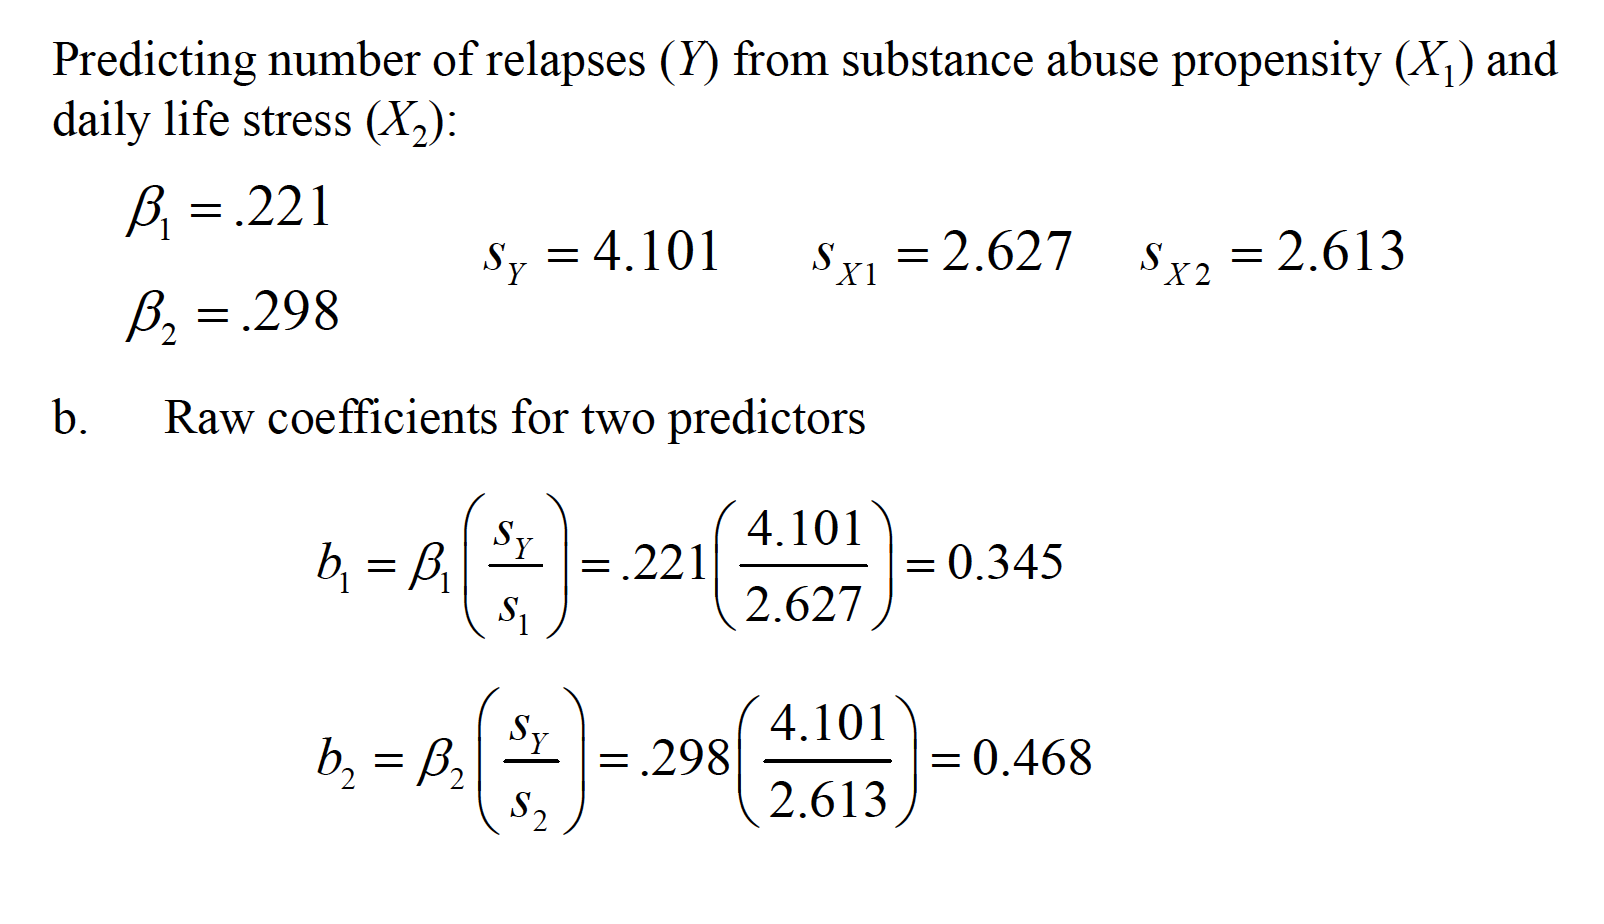
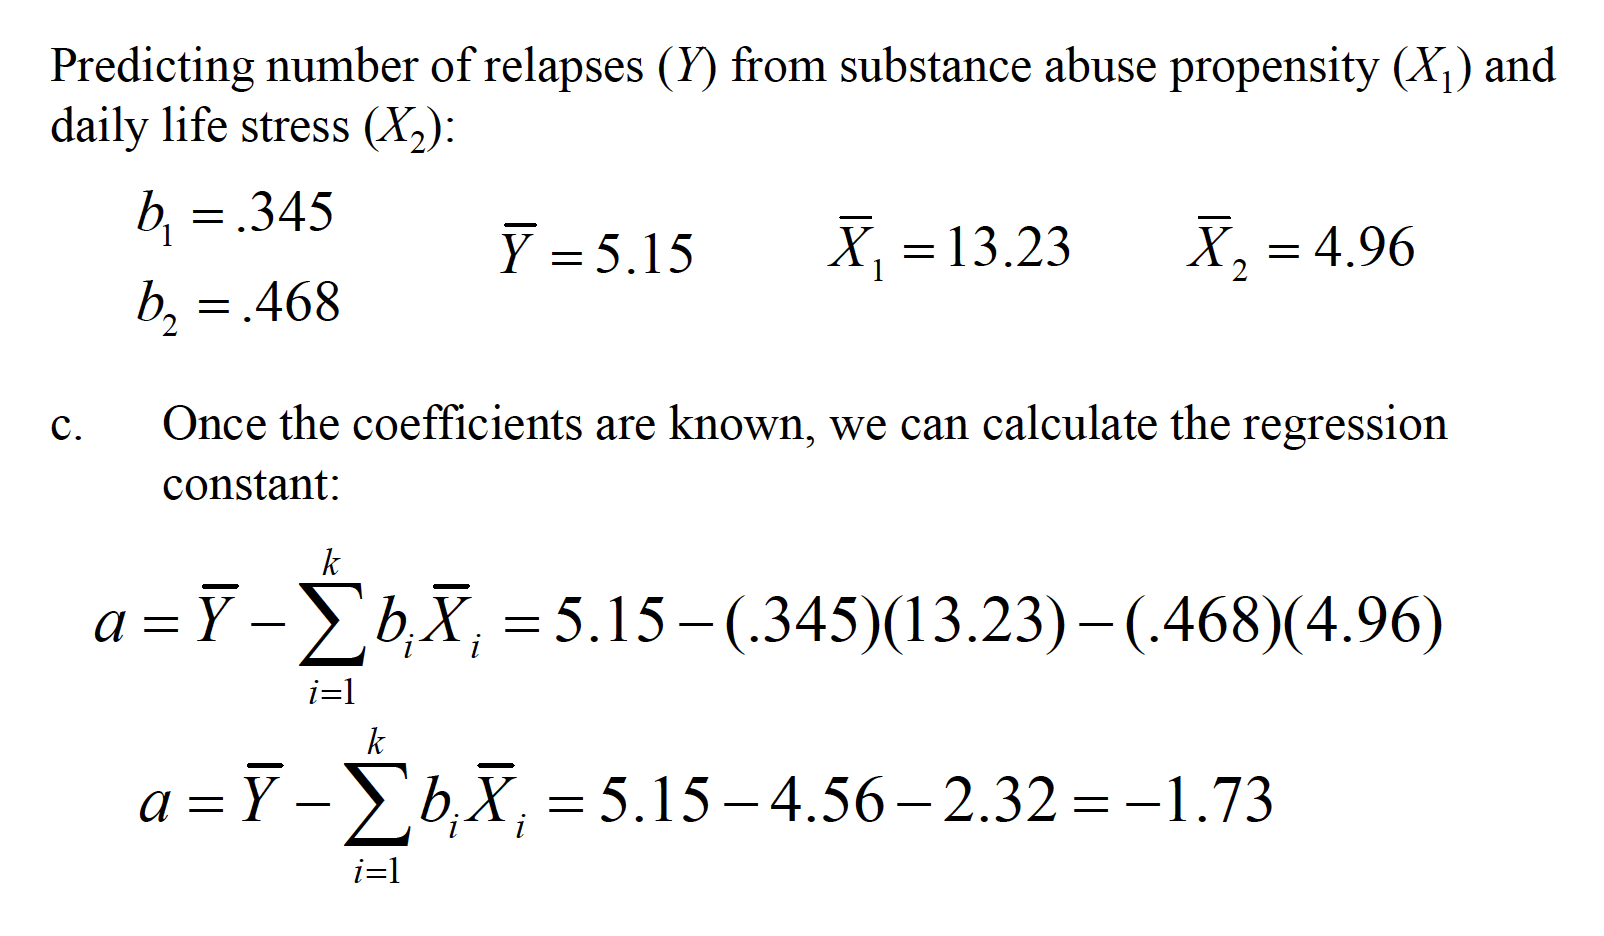
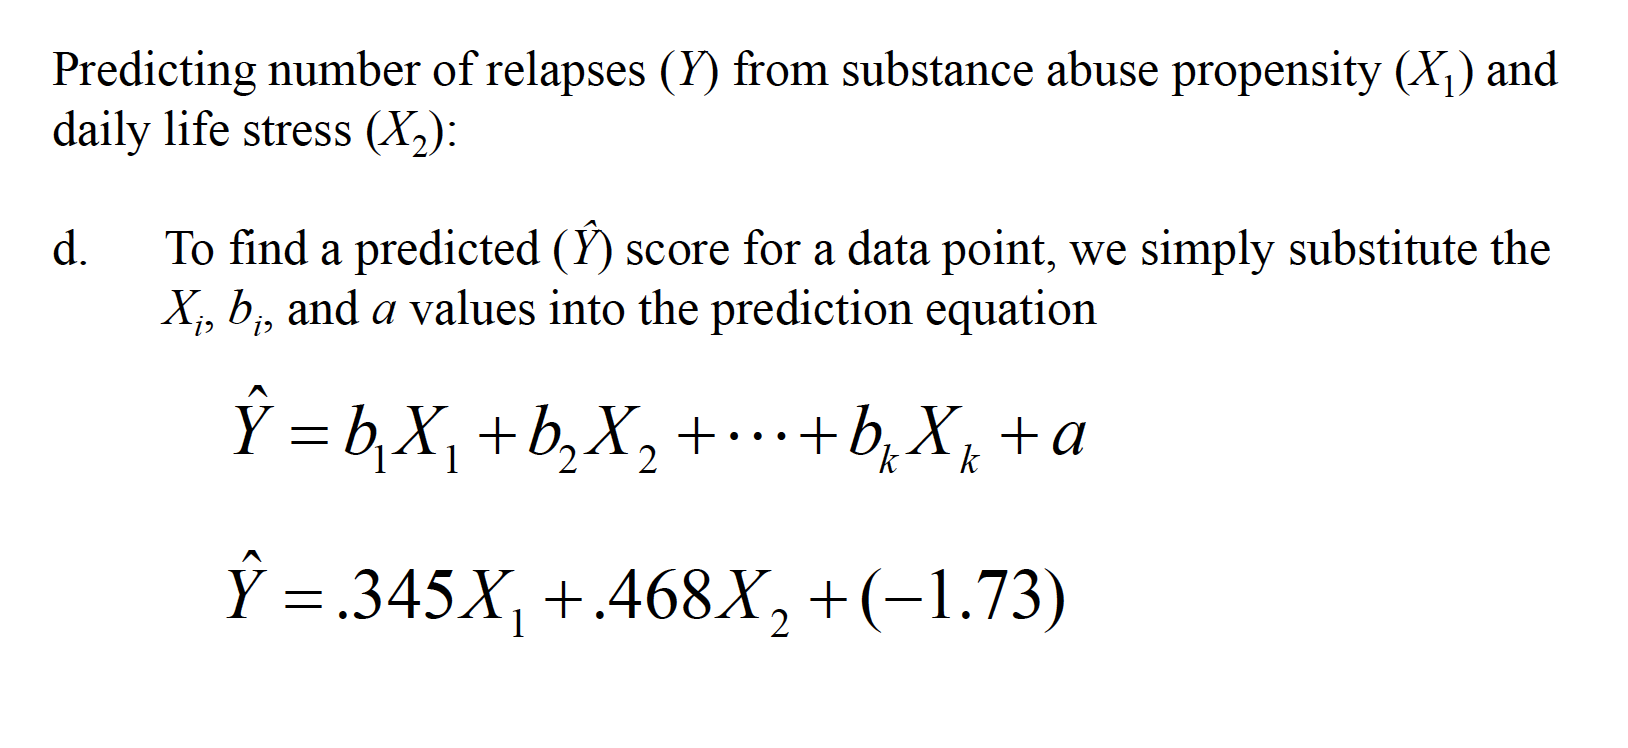
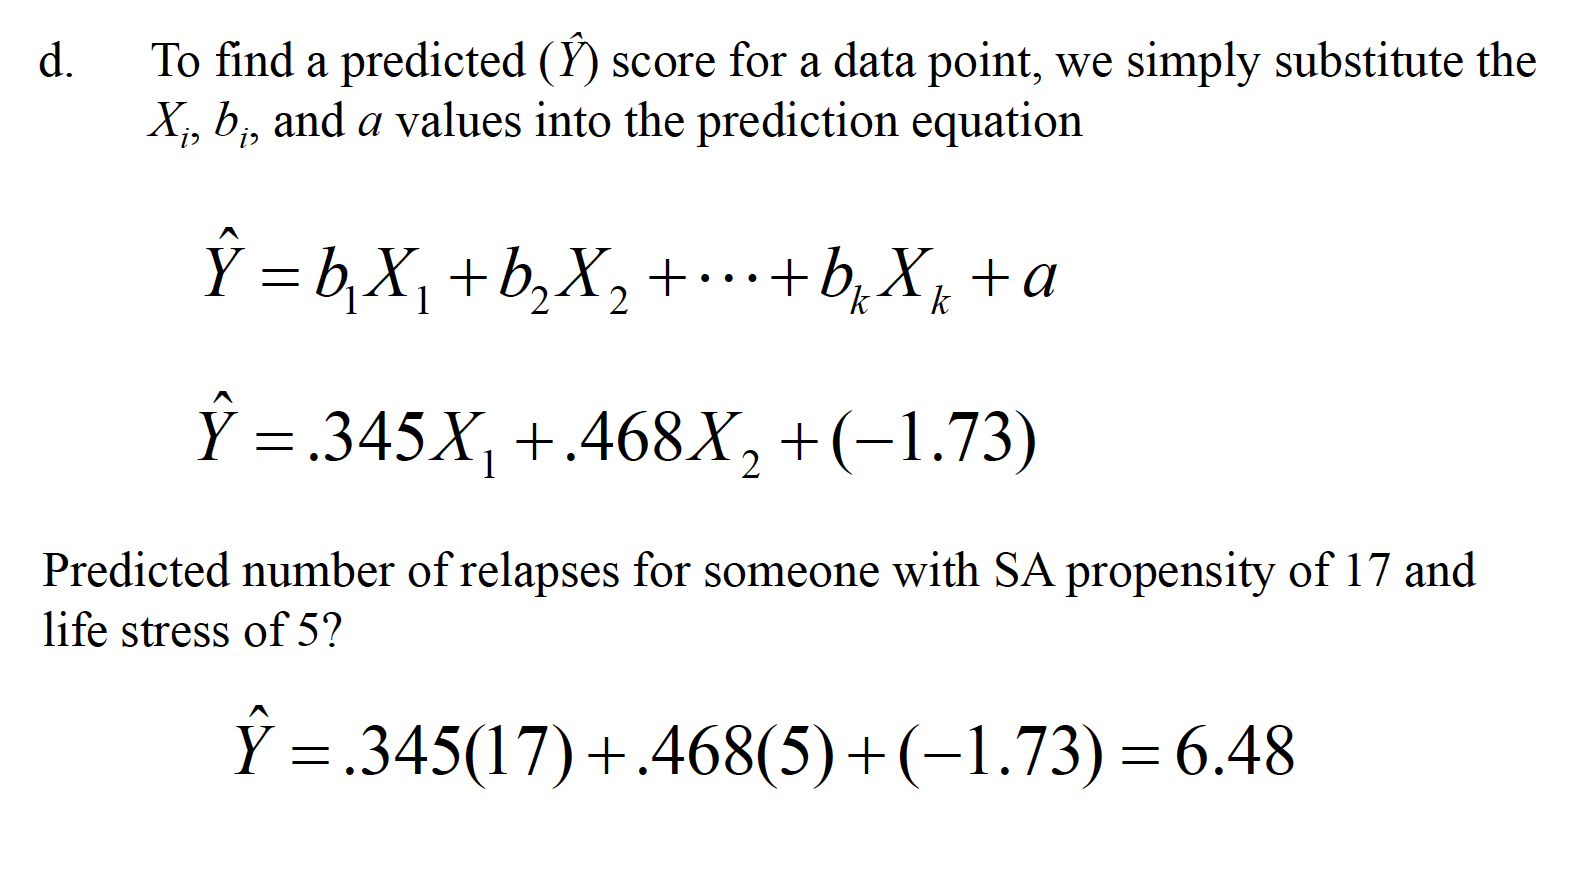
Predicting number of relapses (Y) from substance abuse propensity (X1) and daily life stress (X2)
mr
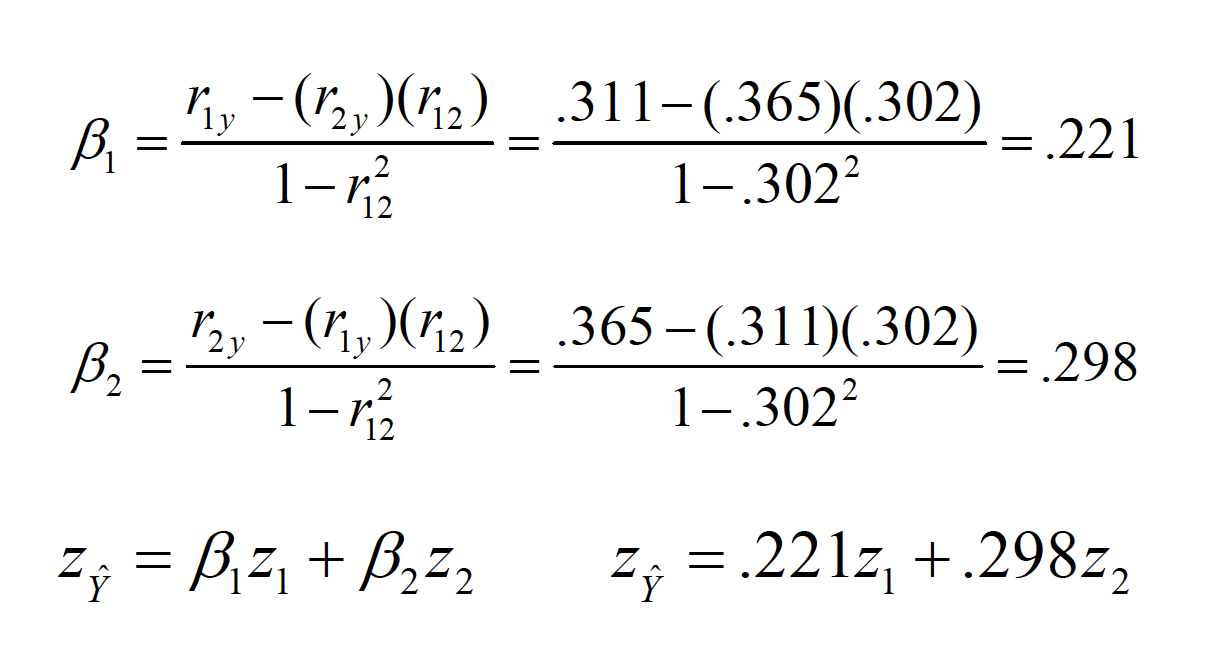
Standardized coefficients (Beta weights) for two predictors
mr
mr
mr
mr
R OUTPUT OF REGRESSION
mr
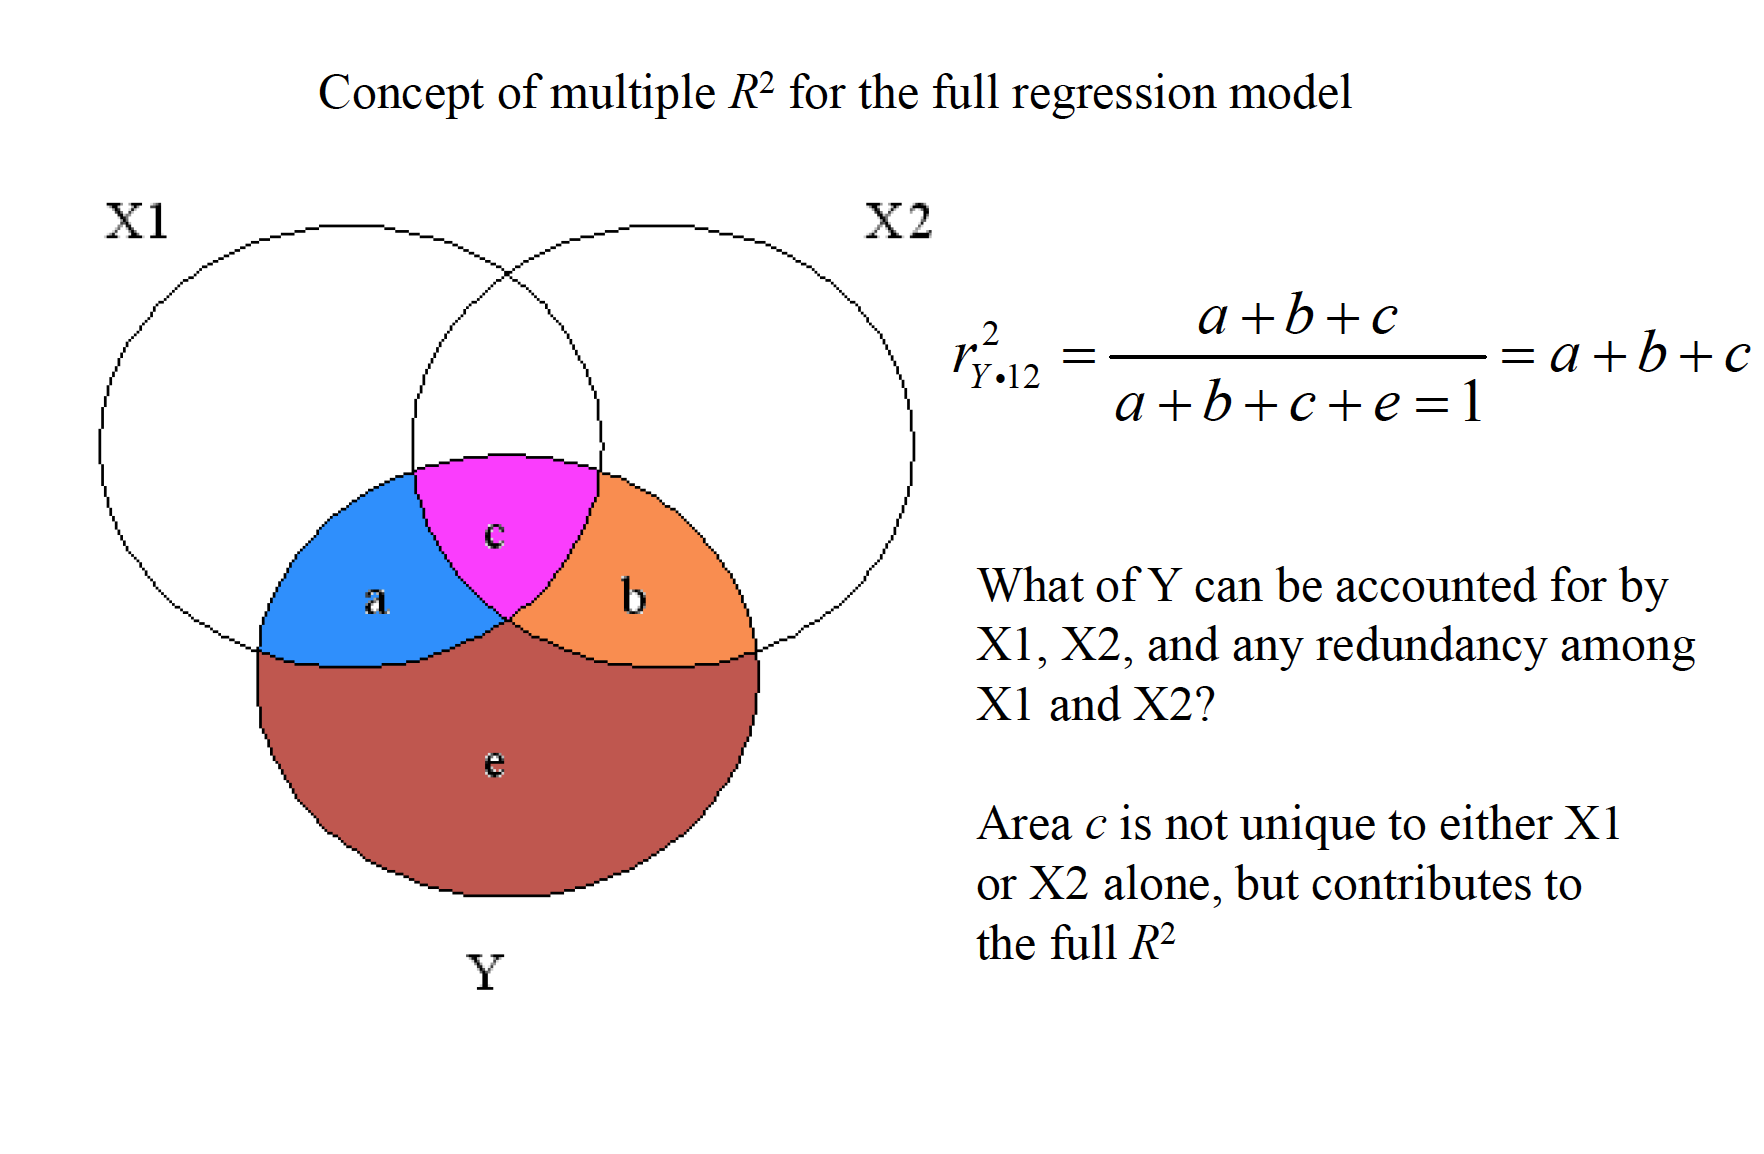
In multiple regression, we have to the multiple correlation coefficient(R) and its associated coefficient of determination (R2).
Multiple Ris a correlation coefficient that represents the entire linear combination of predictors, rather than the simple correlation of a given Xvariable with Y.
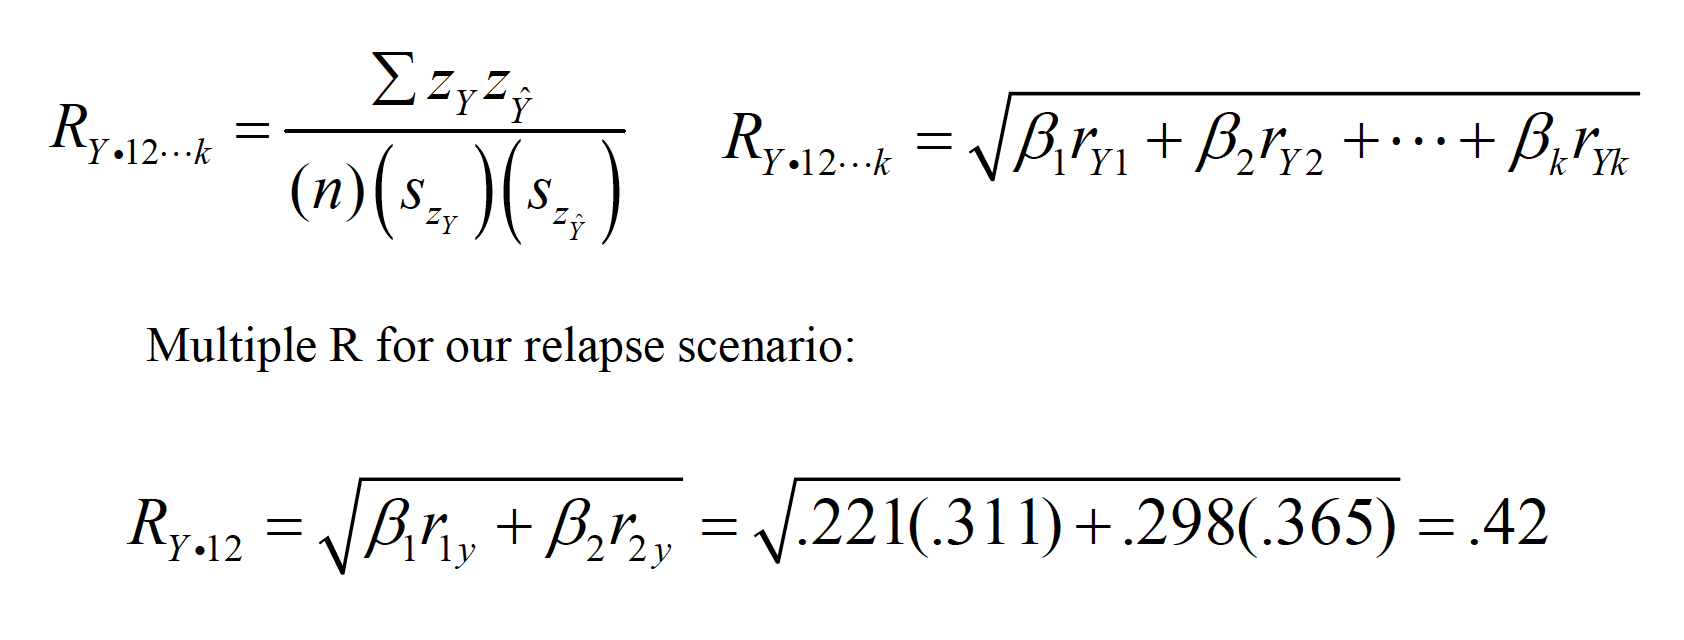
mr
Multiple Rranges from 0 to 1 (i.e., cannot be negative). Multiple Ralso represents the correlation between each Yscore and its associated Ŷ score. Multiple R2is the amount of variance in Yshared by the linear combinationof predictors.
R2 = .42^2 = .176
Multiple R2can overestimate the true amount of shared variance when there are numerous predictors and a small number of observations, so an adjustment for this problem has been identified:
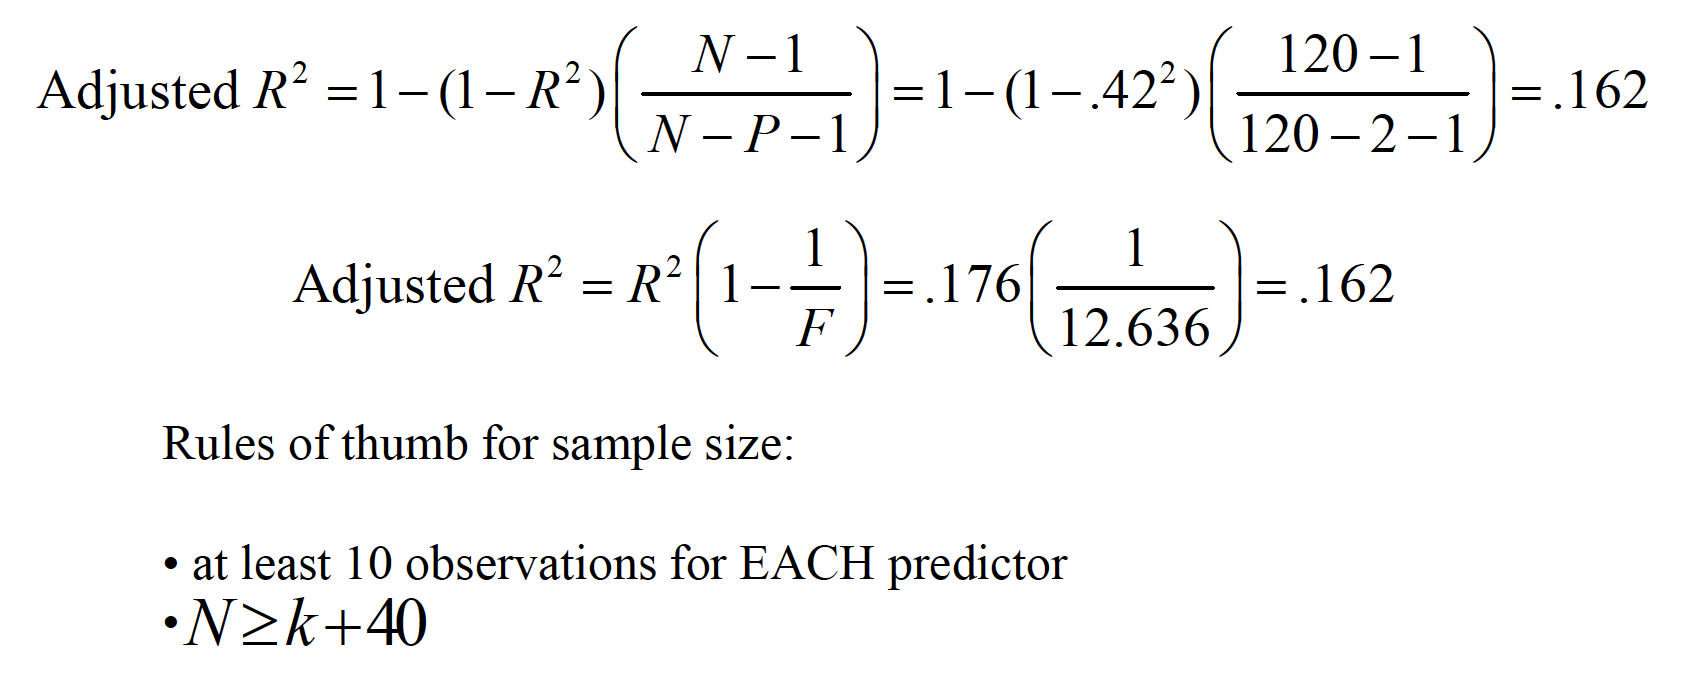
mr
Testing for significance.
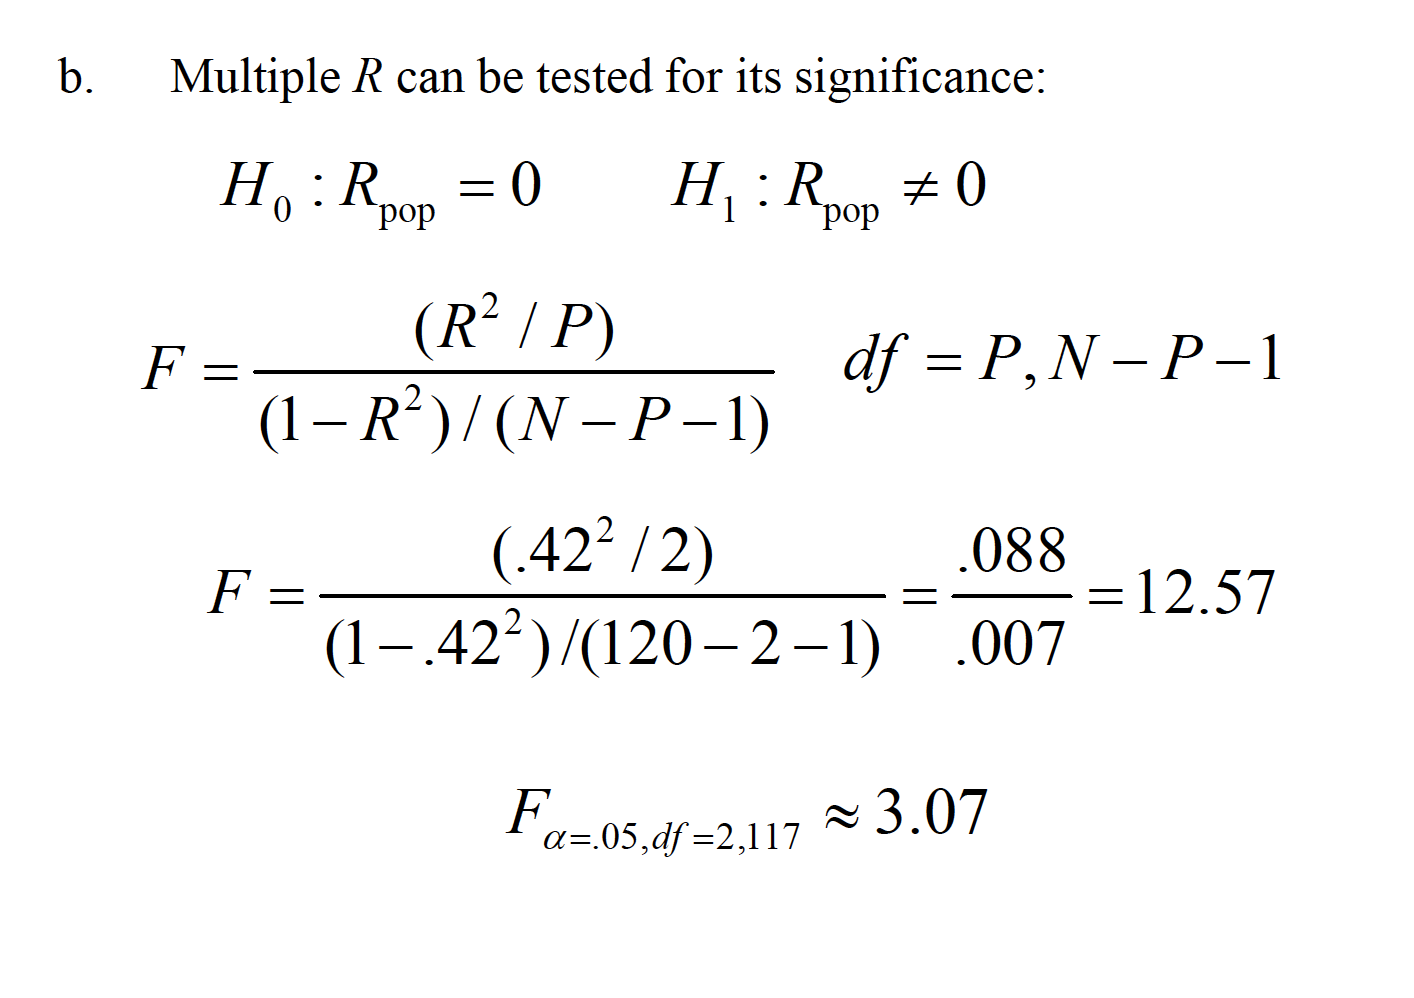
mr
mr
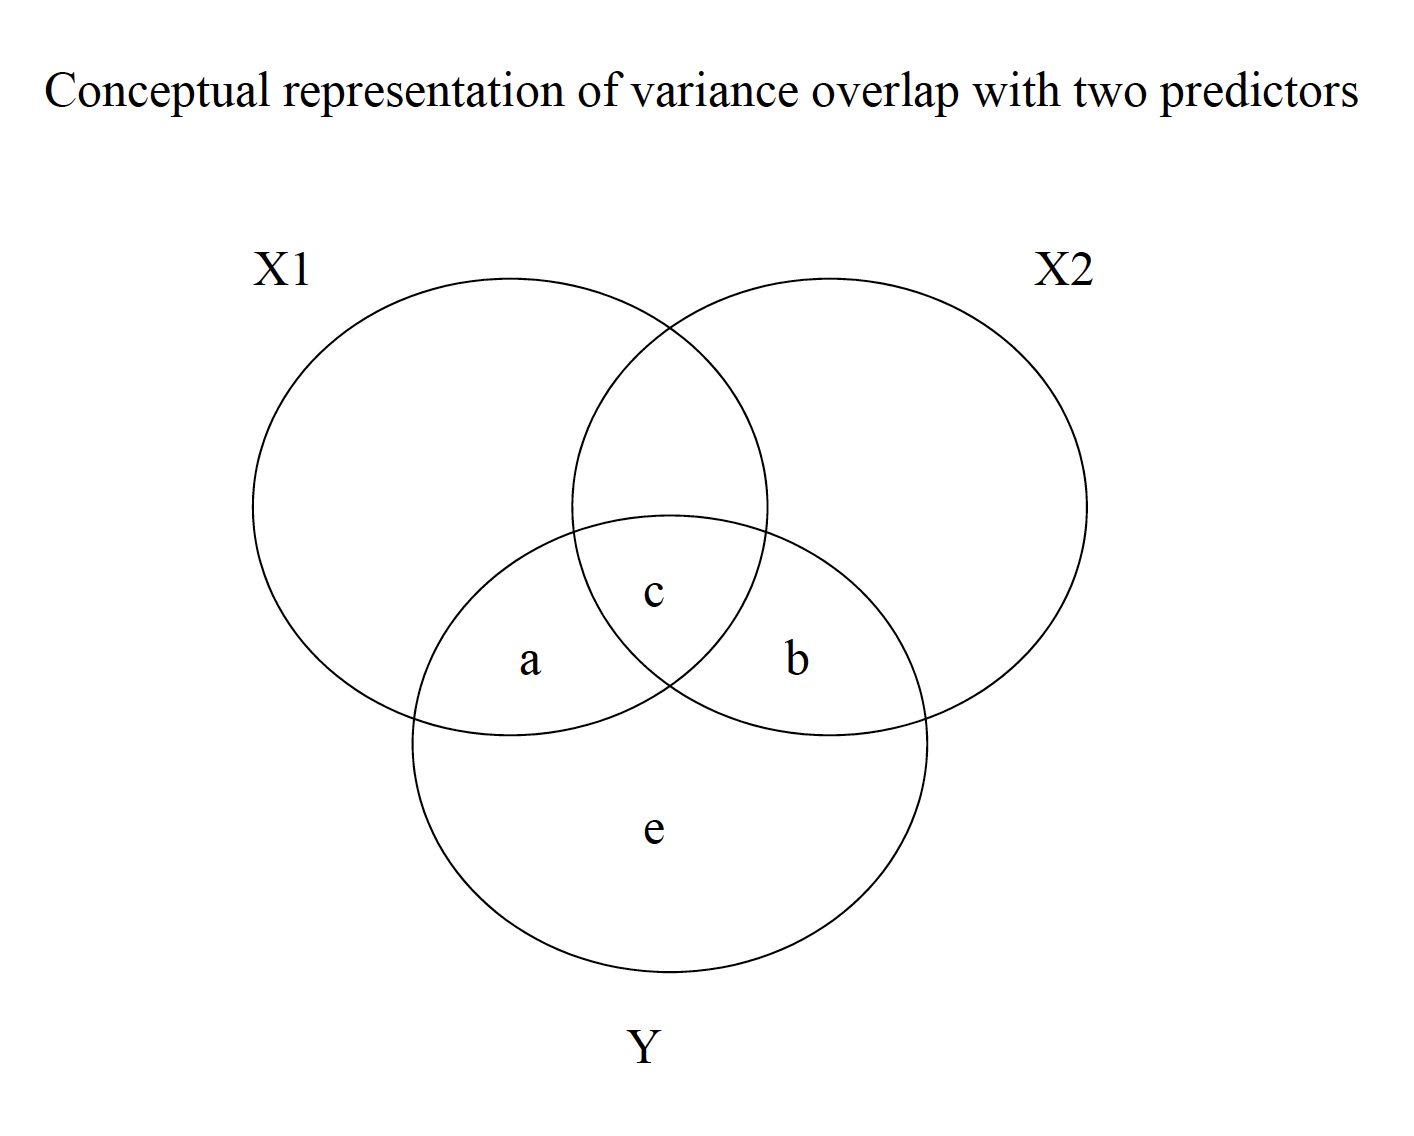
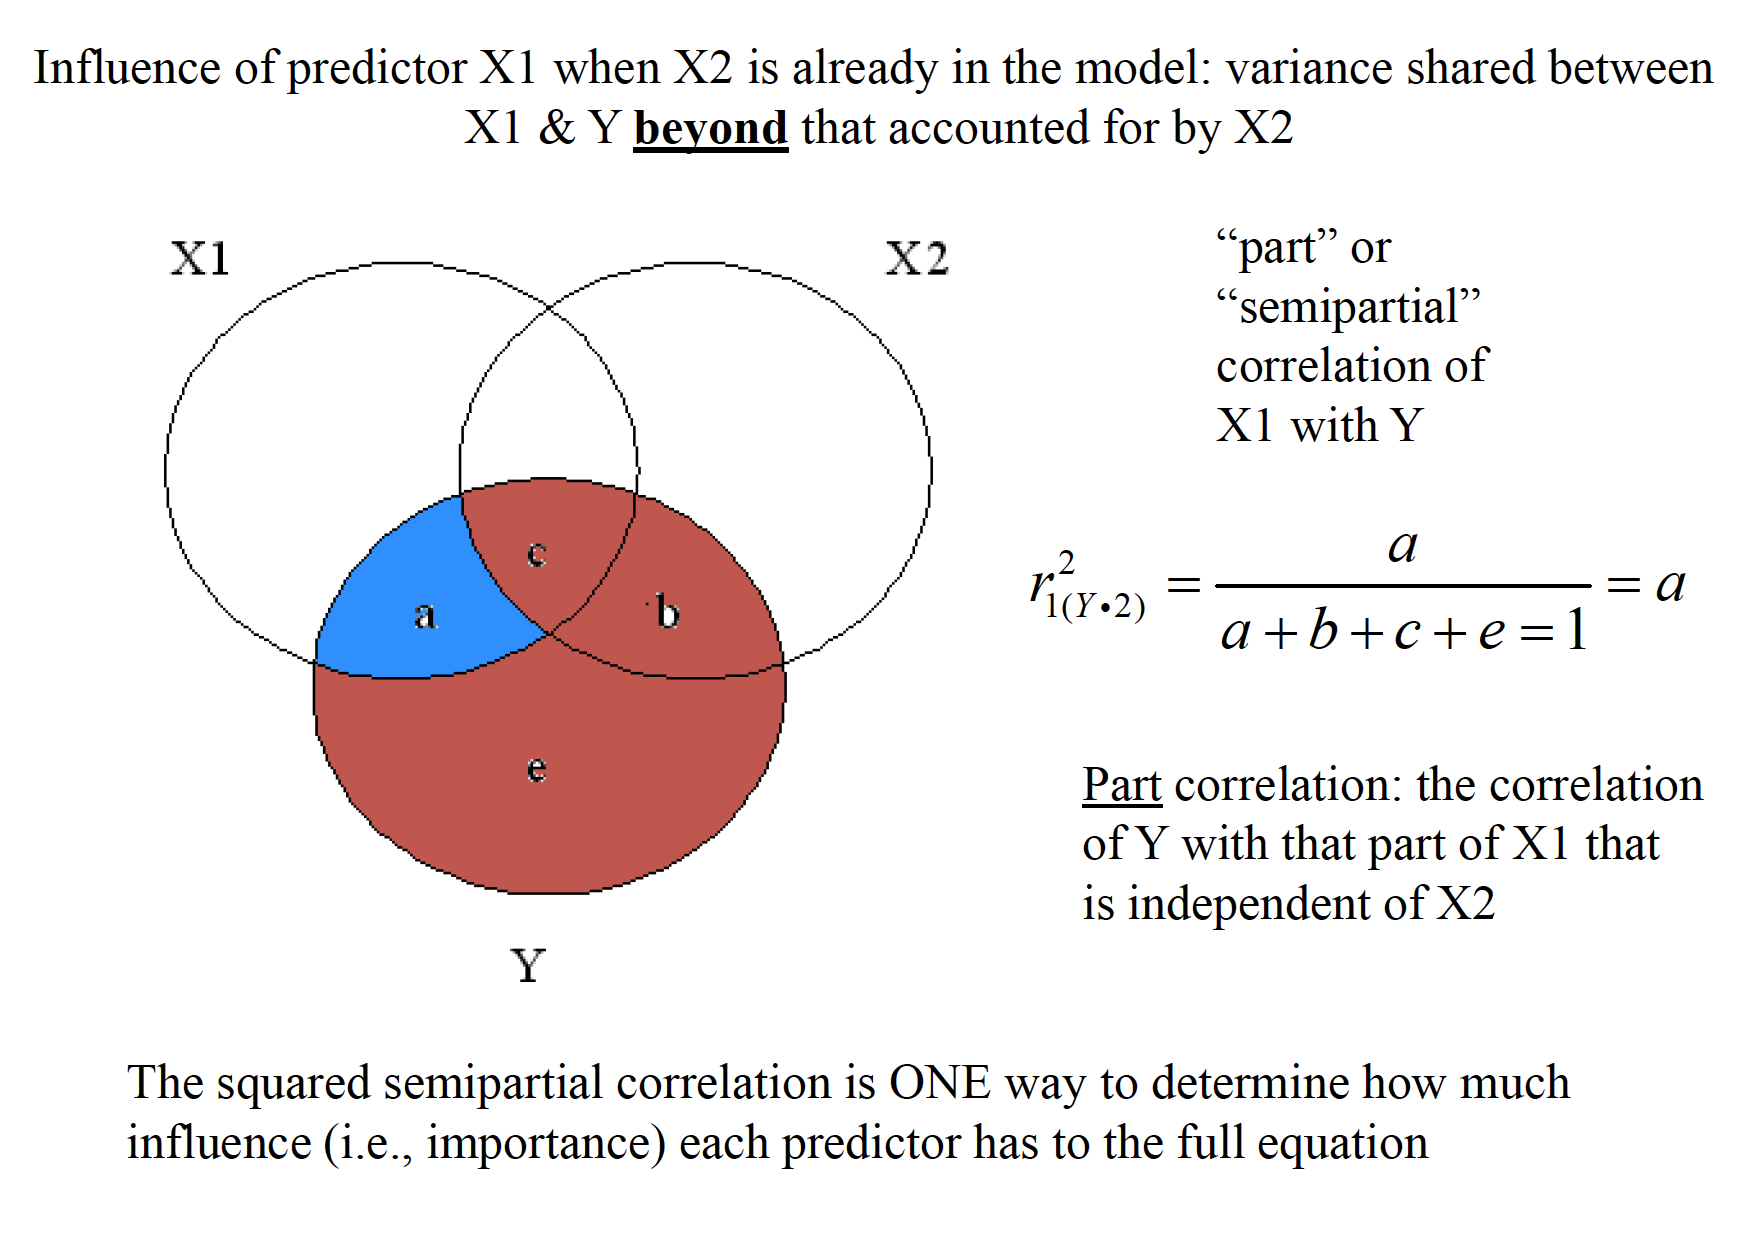
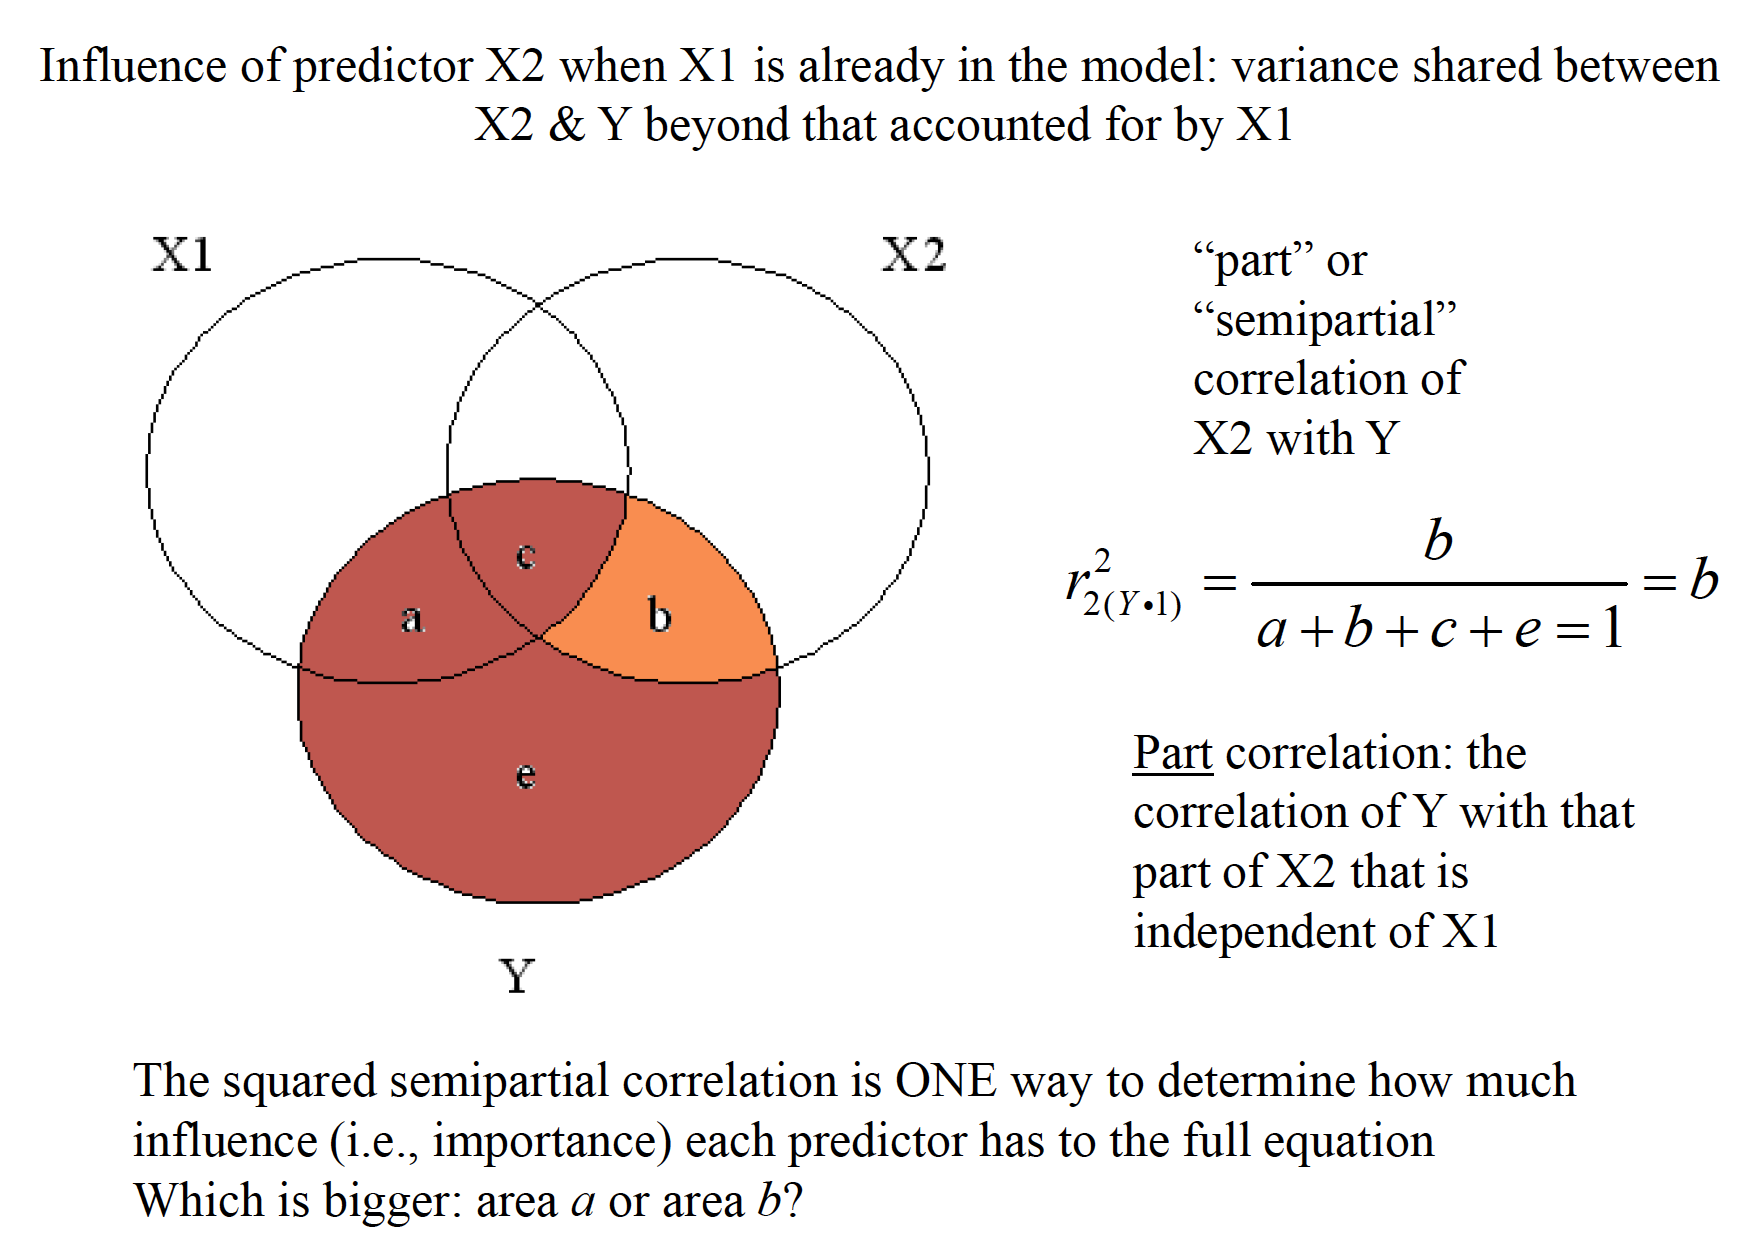
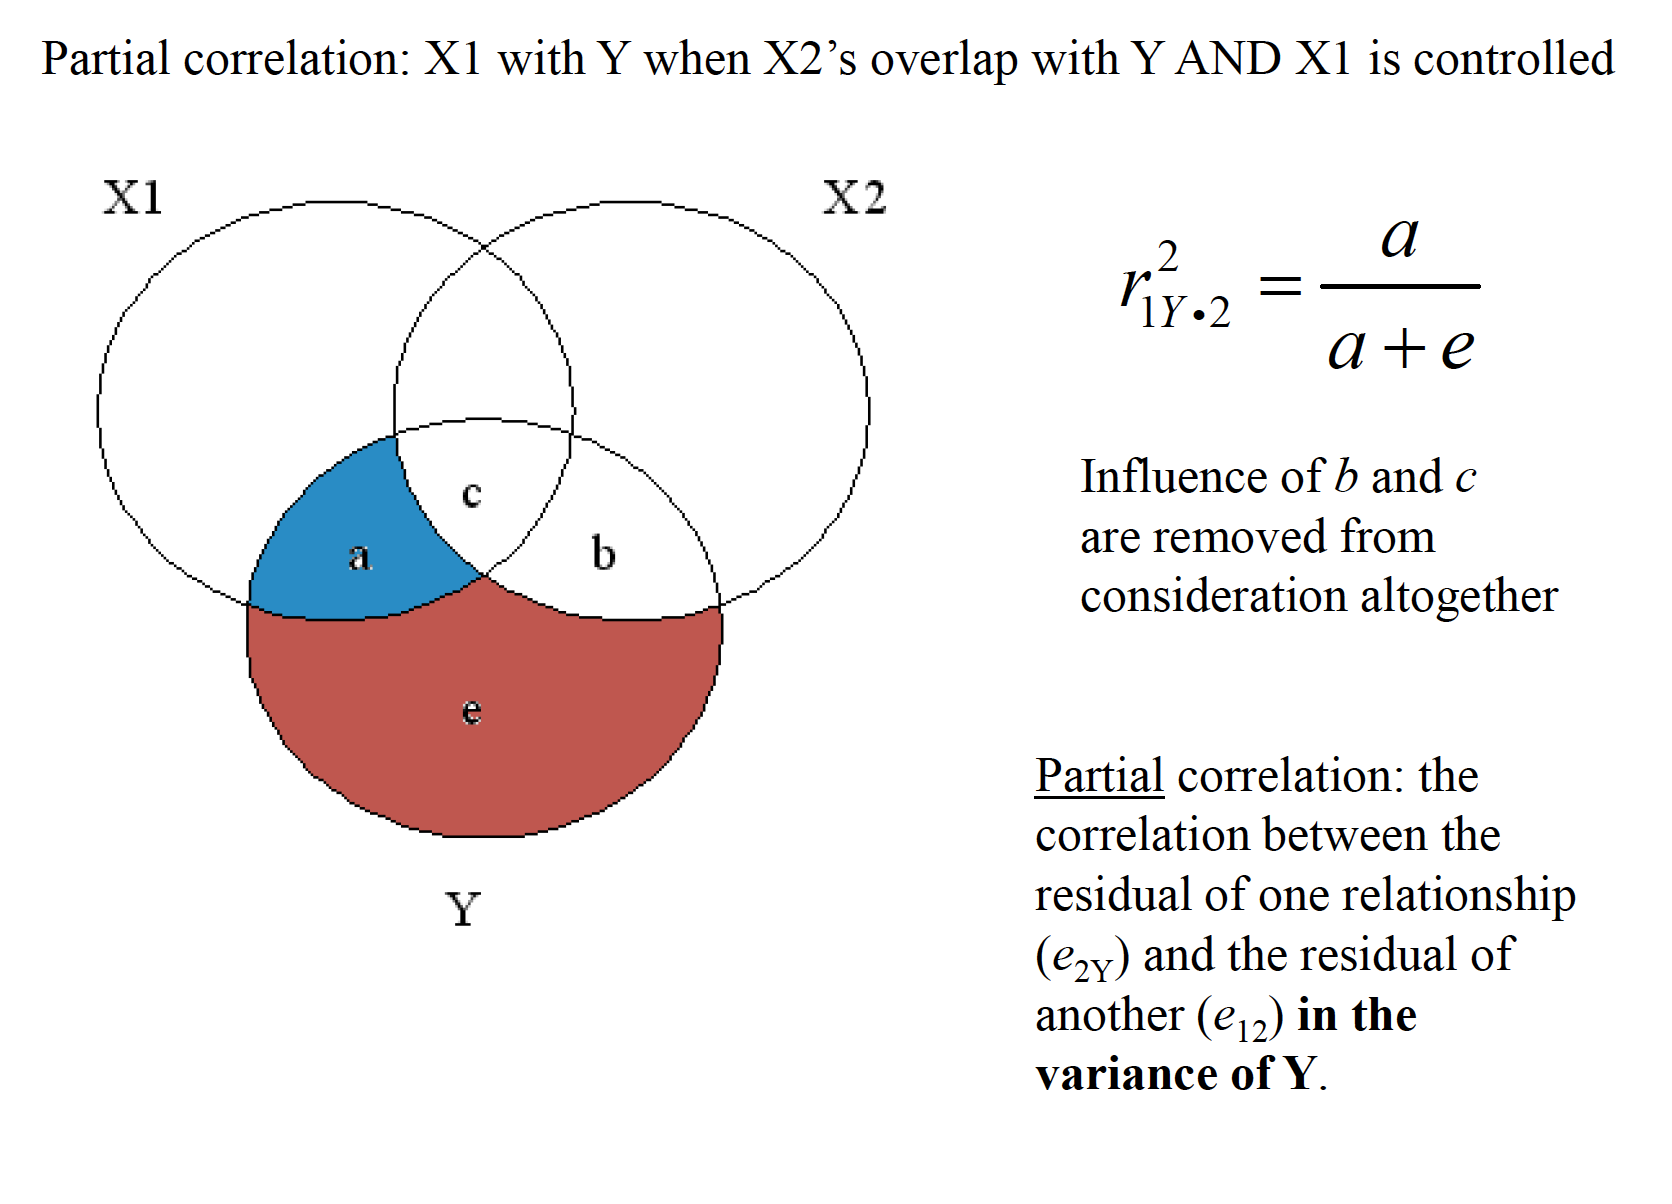
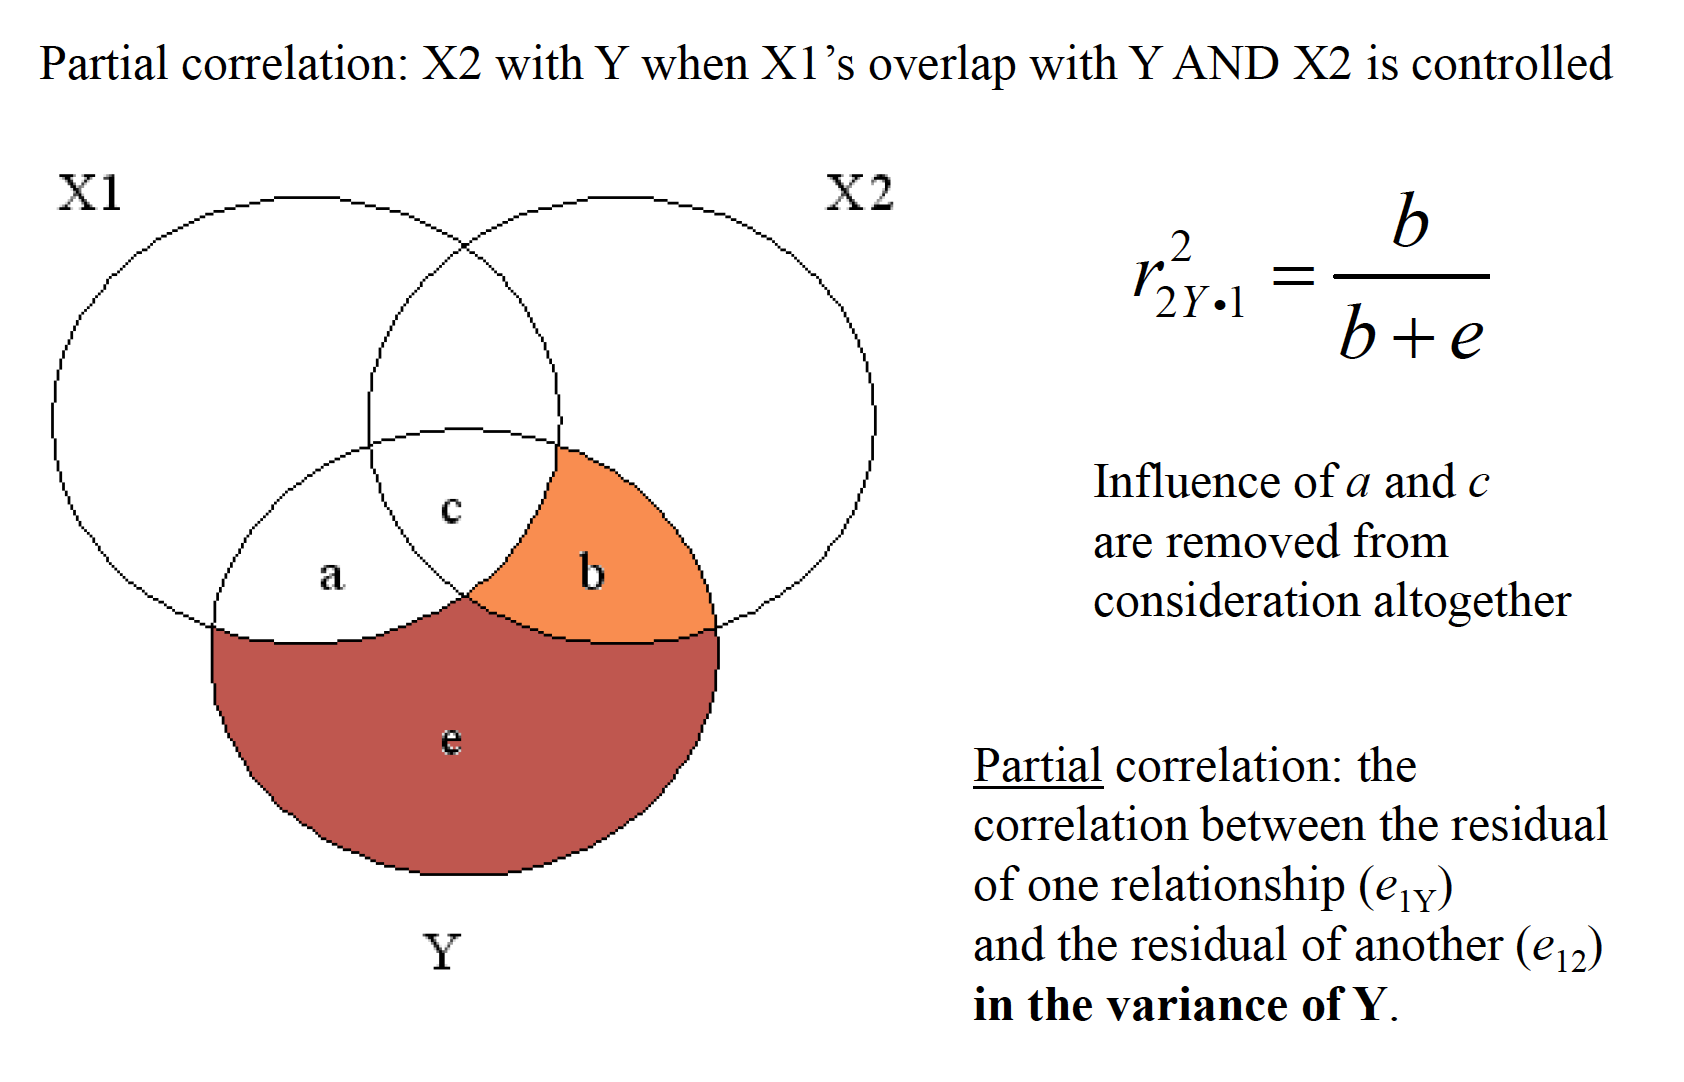
17.1 Conceptual Representation
mr
mr
mr
mr
mr
mr
17.1.1 Second Part
- Regression diagnostics involve identifying potential outlying observations to help refine the prediction equation.
- Constructing an efficient and valid regression equation requires a consideration of many factors.
- Various selection methods are available for finding the “best” regression model, but each has its own drawbacks.
Distanceor discrepancyrefers to the error in prediction in the criterion variable. -could be random error, could be incorrectly recorded, couldbe an unusual case that is justified in being thrown out -a ttest on the residuals can be requested, called the Studentized residual, with (N-P-1) degrees of freedom -keep in mind that a ttest is being done for each observation, so a Bonferronicorrection for multiple comparisons is probably a good idea ˆYYe−=
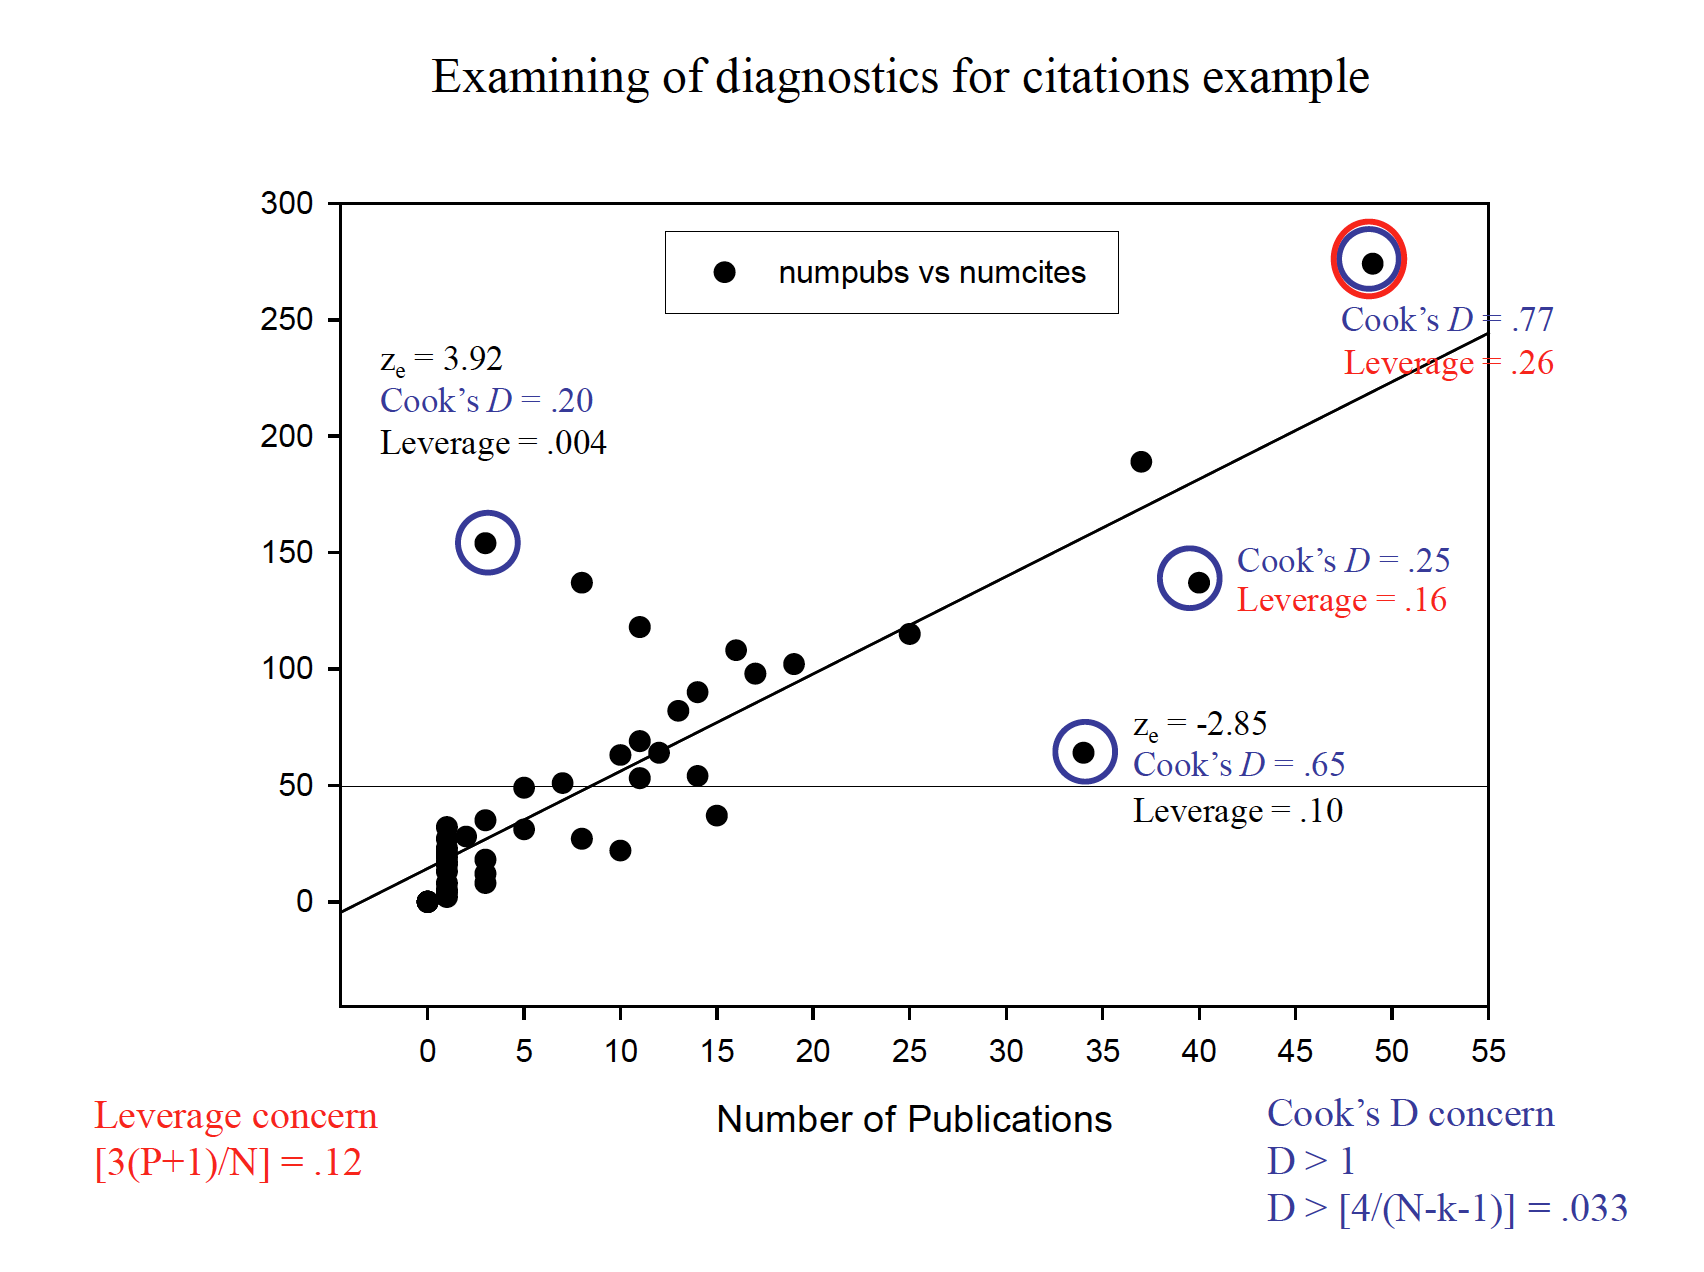
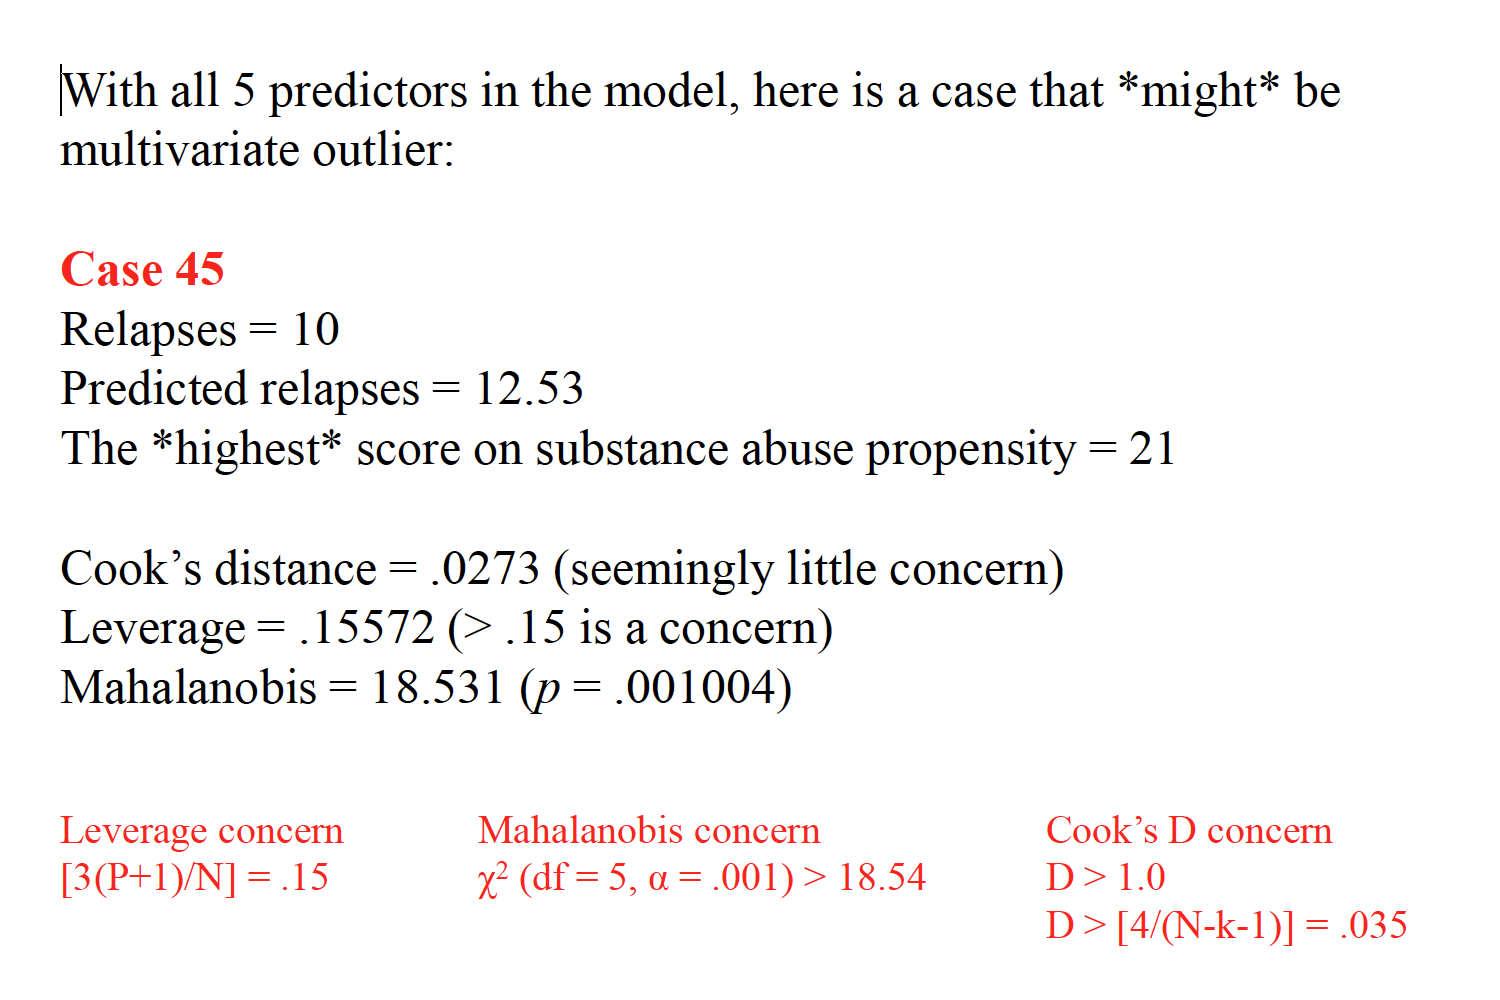
b.Leverage(often denoted hi) helps to identify outliers based on the predictor variables X1, X2, and so on. -possible values of leverage range from 1/N to 1.0, with a mean of [(P+1)/N] -some recommend carefully inspecting observations with leverage values of [3(P+1)/N] or greater
Influencecombines distance and leverage for a given observation to ascertain whether that observation markedly changes the regression surface (i.e., the equation). -most common measure is Cook’s D -reflects the change in a regression coefficient if the offending observation were taken out and the regression re-computed -values over 1.0 are highly unusual and merit scrutiny -a more conservative rule of thumb is if Cook’s D > [4/(N –k –1)]
mr
Mahabanolisdistance measures the uniqueness of a given observation based on its value and the mean values for all other cases of the predictors in the model
mr
Tolerancerefers to the degree to which one predictor can itself be predicted by the remaining predictors in the model -if the multiple correlation from all other predictors here is RX, then tolerance is the leftover unexplained variance, or -it tells us the degree of overlap among predictors—lower values of tolerance represent potential problems (lower than .20 or so is a flag) -we want the multiple correlation among predictors to be rather low, and therefore tolerance to rather high
Variance inflation factor(VIF) is the reciprocal of tolerance and represents how much the standard error of a given predictor coefficient is made larger because of high correlations with other predictors -we want low standard errors for coefficients, and therefore low VIF values (values over 10 or so might cause concern). -if eliminating a predictor variable with high VIF and low tolerance helps to generate a more stable model (i.e., low sampling error), then it may be a good idea to do so
Various selection methods are available for finding the “best” regression model, but each has its own drawbacks. a. The all subsetsmethod essentially requires fitting all possible combinations of predictor variables to see which provides the best R2or that minimizes MSres -one problem with this technique is that it could capitalize on chance -your particular sample may have data points that are not representative of the population b. Backward eliminationinvolves putting all predictors into the model and then removing those that contribute the least to the model -this is done iteratively until we are left with the model that only includes influential predictors
- Stepwiseregression is the opposite of backward elimination, where we add the most influential predictor, then the next most, and so on. -at each step in the process, before adding a new variable, we determine whether any current predictors should be removed on the basis that they no longer make a contribution -selection stops when remaining predictors will not make a contribution -forward selectionprocedures can be used so that previously added predictors are not removed at any future step
- Hierarchical regression is a method used to force the entry of variables in a particular order
overall, the stepwise method is likely the best, although these methods should be used primarily when trying to create the best prediction, rather than trying to test theory
EXAMPLE OF STEPWISE REGRESSION IN R
CAN YOU GET THIS DATASET FROM JH